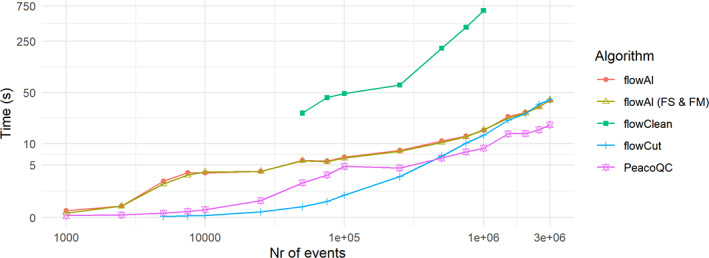
FIGURE 7.

Running time analysis comparison of different quality control algorithms. The 010 file of the FlowCAPIV data was concatenated five times. From this data, a number of events were uniformly for peer review subsampled over time and used for quality control by the different quality control algorithms. The cleaning was done three times and timed by the system. Time function of the base R package. The mean of these results is displayed (FS & FM: for this comparison, a quality control analysis was done with the flowAI algorithm where the flow rate was not taken into account) [Color figure can be viewed at wileyonlinelibrary.com]
