Figure 1.

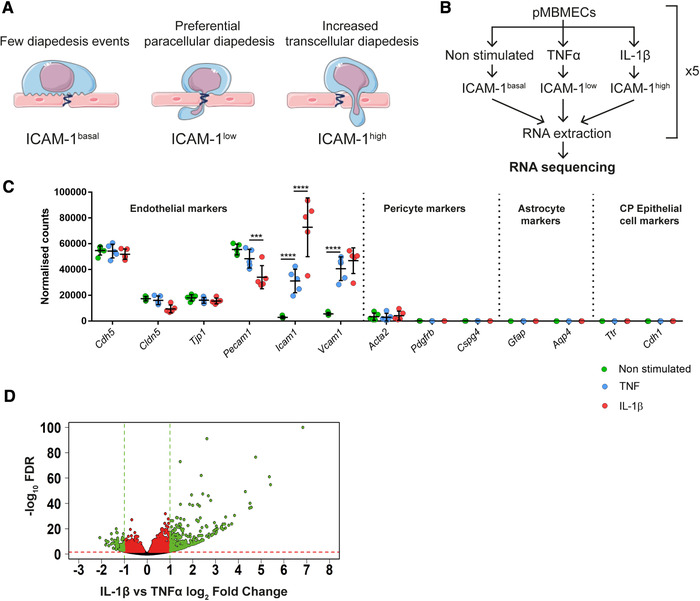
Workflow and RNA‐seq analysis of cytokine‐stimulated pMBMECs. (A) Schematic representation of T‐cell diapedesis pathway across pMBMECs in association with the endothelial ICAM‐1 levels. T‐cell, endothelial cells, and junctions were adapted from Servier Medical Art (http://smart.servier.com/), licensed under a Creative Common Attribution 3.0 Generic License. (B) Diagram of RNA‐seq study design. pMBMECs were stimulated for 4 h with 10 ng/ml TNF‐α or 20 ng/ml IL‐1β. RNA was isolated at five different timepoints in parallel producing five biological replicates per experimental group and the samples were sequenced. (C) RNA‐seq expression level of the chosen genes shown as normalized reads. CP, Choroid Plexus. Data shown as mean ± SD of the respective five biological replicates. Statistical analysis was performed using the Benjamini‐Hochberg algorithm on the p‐values in order to obtain the False Discovery Rate (FDR). ***FDR ≤ 0.001; ****FDR ≤ 0.0001. (D) Volcano plot of IL‐1β versus TNF‐α‐stimulated pMBMECs gene expression. Differentially expressed genes between IL‐1β and TNFα stimulation were identified and further selected according to selected criteria described in detail in Results and Materials and methods. Volcano plot shows gene expression as log2Fold Change between normalized mean of reads from IL‐1β versus TNF‐α stimulated pMBMECs. FDR is shown as ‐log10 for visualization purposes; 1.3 on the Y‐axis is the equivalent of ‐log10 of 0.05 and was considered as a threshold for positive selection. Green and red dotted lines represent the selection thresholds. Black dots: genes with adjusted FDR < 1.3; Red dots: genes with log2‐fold change between ‐1 and 1 and FDR ≥ 1.3; Green dots: genes with simultaneous FDR ≥ 1.3 and log2‐fold change ≤ ‐1 or ≥ 1. Genes labeled in green were selected for further steps.
