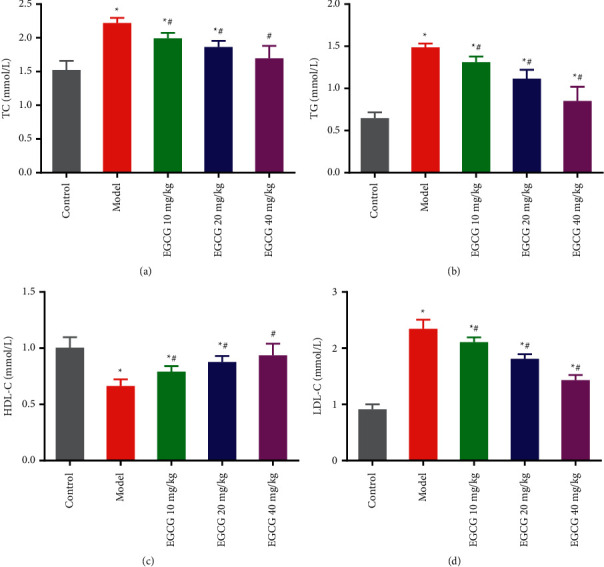
Figure 2.

Effect of EGCG on lipid levels in vivo in CHD mice. ELISA of the serum levels of TC (a), TG (b), HDL-C (c), and LDL-C (d) in each group. ∗P < 0.05 vs. Control group; #p < 0.05 vs. Model group. CHD, coronary heart disease; EGCG, epigallocatechin gallate; TC, total cholesterol; TG, triglyceride; HDL-C, high-density lipoprotein cholesterol; LDL-C, low-density lipoprotein cholesterol.
