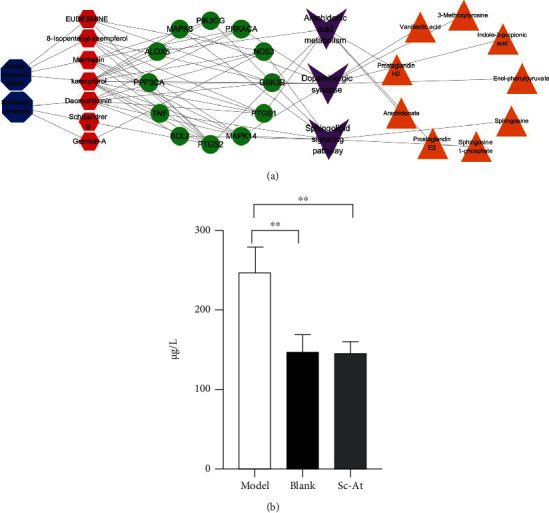
Figure 9.

(a) Network pharmacology-metabolomics association analysis component-target-pathway-metabolite schematic diagram. Notes: the large and small octagon denotes medicinal herbs (SC, AT) and corresponding ingredients, red denotes target points, purple square denotes the metabolic pathway, and yellow triangles represent metabolites. (b) Expression of TNF-α in rat plasma (n = 3, ∗P < 0.05).
