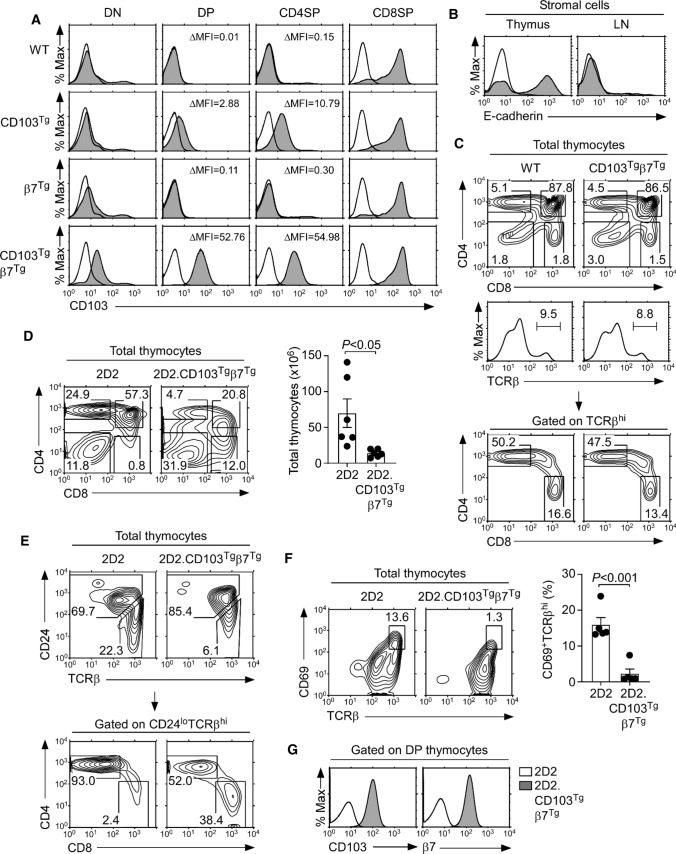
Fig. 4.
Generation of CD103+ CD4 T cells by transgenic expression of CD103 and β7. A Surface CD103 expression on DN, DP, and mature CD4SP and CD8SP thymocytes of WT, CD103Tg, β7Tg, and CD103Tgβ7Tg mice. Shaded histograms show anti-CD103 staining; open histograms indicate control antibody staining. ∆Mean Fluorescence Intensity (∆MFI) of CD103 expression was determined by subtracting the control antibody MFI from CD103 MFI. The results are representative of 7 independent experiments with a total of 7 WT, 7 CD103Tg, 7 β7Tg, and 7 CD103Tgβ7Tg mice. B E-cadherin expression on thymus and LN stromal cells. Shaded histograms show anti-E-cadherin staining; open histograms indicate control antibody staining. Results are representative of at least 2 independent experiments. C CD4 versus CD8 profile of total (top) or TCRβ+-gated (middle) mature thymocytes of WT and CD103Tgβ7Tg mice. The results are representative of 8 independent experiments with a total of 10 WT and 10 CD103Tgβ7Tg mice. D CD4 versus CD8 thymocyte profiles and cell numbers of 2D2 and 2D2.CD103Tgβ7Tg mice. The contour plot is representative (left) and the graph (right) is the summary of 5 independent experiments with 6 2D2 and 6 2D2.CD103Tgβ7Tg mice. E CD24loTCRβhi mature CD4 and CD8 T cells in 2D2 and 2D2.CD103Tgβ7Tg mice. Mature thymocytes were identified by CD24 versus TCRβ staining (top), and CD4 versus CD8 expression were determined among CD24loTCRβhi thymocytes (bottom). Results are representative of 4 independent experiments with 5 2D2 and 5 2D2.CD103Tgβ7Tg mice. F CD69+TCRβhi thymocytes in 2D2 and 2D2.CD103Tgβ7Tg mice. Thymocytes undergoing positive selection were identified by the co-expression of CD69 and TCRβ. The contour plot is representative (left) and the graph (right) is the summary of 4 independent experiments with 5 2D2 and 5 2D2.CD103Tgβ7Tg mice. G Surface CD103 and β7 expression on DP thymocytes of 2D2 and 2D2.CD103Tgβ7Tg mice. Results are representative of 4 independent experiments with 5 2D2 and 5 2D2.CD103Tgβ7Tg mice

