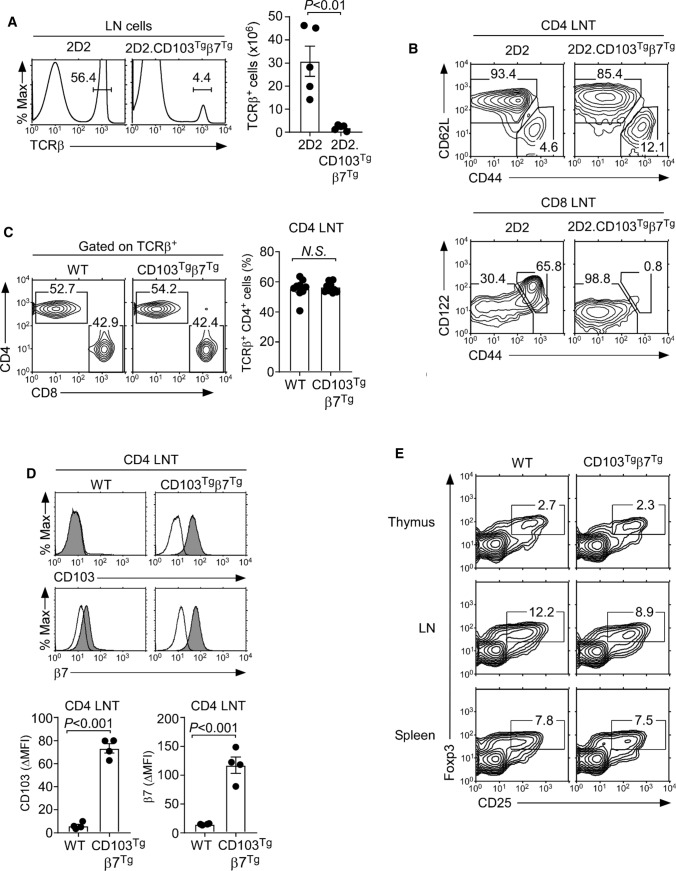
Fig. 5.
Phenotypic characterization of CD103Tg CD4 T cells. A LN T cell frequency and numbers in 2D2 and 2D2.CD103Tgβ7Tg mice. The histogram is representative (left) and the graph (right) is the summary of 4 independent experiments with 5 2D2 and 5 2D2.CD103Tgβ7Tg mice. B Phenotype of 2D2 and 2D2.CD103Tgβ7Tg LN T cells. Naïve versus memory phenotype was assessed by CD44 versus CD62L staining in CD4 LN T cells (top) and by CD44 versus CD122 staining in CD8 LN T cells (bottom). Results are representative of 3 independent experiments with 4 2D2 and 4 2D2.CD103Tgβ7Tg mice. C CD4 versus CD8 profiles of TCRβ+-gated LN T cells from WT and CD103Tgβ7Tg mice (left). The bar graph shows CD4 T cell frequencies from LNs of WT and CD103Tgβ7Tg mice (right). The results show the summary of 8 independent experiments with a total of 9 WT and 9 CD103Tgβ7Tg mice. D CD103 and β7 expression were determined on CD4 LN T cells of the indicated mice (top). Histograms show staining of anti-CD103 or anti-β7 (shaded) versus isotype control antibody (open). Bar graphs show the ΔMFI of CD103 and β7 on CD4 LN T cells of the indicated mice (bottom). The results are a summary of 4 independent experiments with a total of 4 WT and 4 CD103Tgβ7Tg mice. E Frequency of Foxp3+ Treg cells in the thymus, LN, and spleen of WT and CD103Tgβ7Tg mice. The results are representative of 6 independent experiments with a total of 6 WT and 6 CD103Tgβ7Tg mice

