
Figure 3.
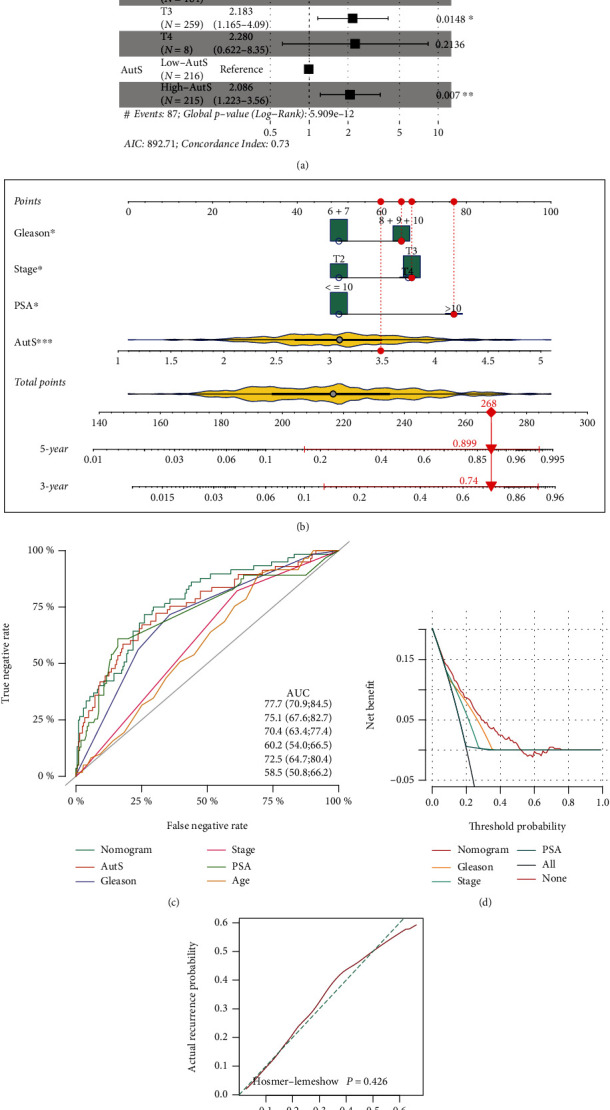
Multivariate Cox regression analysis and nomogram risk model establishment. (a) Independent prognosis analysis via multivariate Cox regression. If the whole segment is located on the right, the corresponding predictor is deemed as a risky factor for PCa or a protective factor which is independence. (b) Establishment of a novel nomogram risk model based on GS, T stage, PSA, and AutS. For a given patient with a GS>7, T3 or T4 stage, PSA>10, and AutS =3.5, we obtained points for each predictor on the points line, calculated the sum of overall points, and found its location on the total points line at the bottom, which was 268. Then, a straight line was delineated from the total point to the 3-year and 5-year lines, and the corresponding points of intersection represented 3-year and 5-year recurrence rates, which were 0.74 and 0.899, respectively. (c) Comparison of discriminative performance between the nomogram and AutS, GS, PSA, T stage, and age in TCGA-PRAD cohort. (d) Clinical value assessment for nomogram via DCA. (e) Calibration analysis for nomogram. Dashed line represented observed value and solid line represented predictive value, and a P > 0.05 implied a good agreement between observation and prediction values.