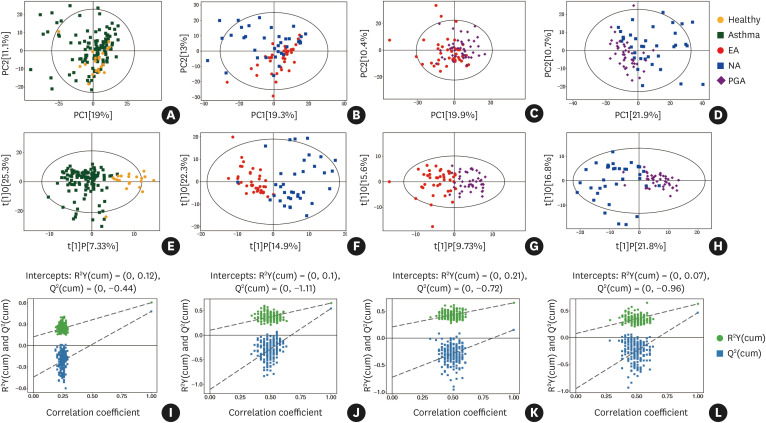
Fig. 1. Untargeted metabolic profiles discriminate different inflammatory phenotypes of asthma and healthy subjects in the discovery set. (A-D) Score plot of PCA model obtained retrospectively from different inflammatory asthma phenotypes, and healthy subjects; (E-H) Score plot of OPLS-DA model obtained retrospectively from different inflammatory asthma phenotypes and healthy subjects; The labels t[1] and t[2] along the axes represent the scores (the first 2 partial least-squares components) of the model, which are sufficient to build a satisfactory classification model. (I-L) Permutation test of the OPLS-DA model was obtained retrospectively from different inflammatory asthma phenotypes and healthy subjects; 200 permutations were performed, and the resulting R2 and Q2 values were plotted.
PCA, principal component analysis; OPLS-DA, orthogonal partial least-squares discriminant analysis; EA, eosinophilic asthma; NA, neutrophilic asthma; PGA, paucigranulocytic asthma.

