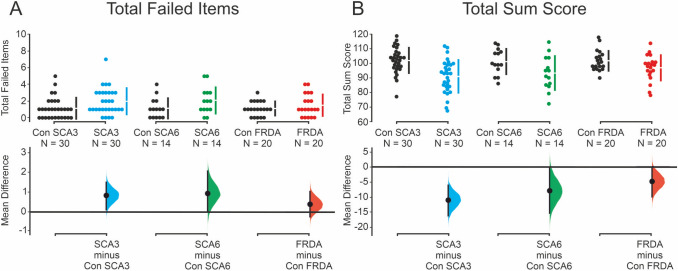
Fig. 1.
Total failed test items and total sum score. The total number of failed test items (A) and the total sum score (B) are shown for SCA3 (blue), SCA6 (green) and FRDA patients (red) and their respective matched controls (black). Upper panels: Each circle represents one participant. Discontinuous bars show means and standard deviations. Lower panels: Mean differences are plotted as a bootstrap sampling distribution. Dots represent mean difference, and 95% confidence intervals are indicated by the ends of the vertical error bars

