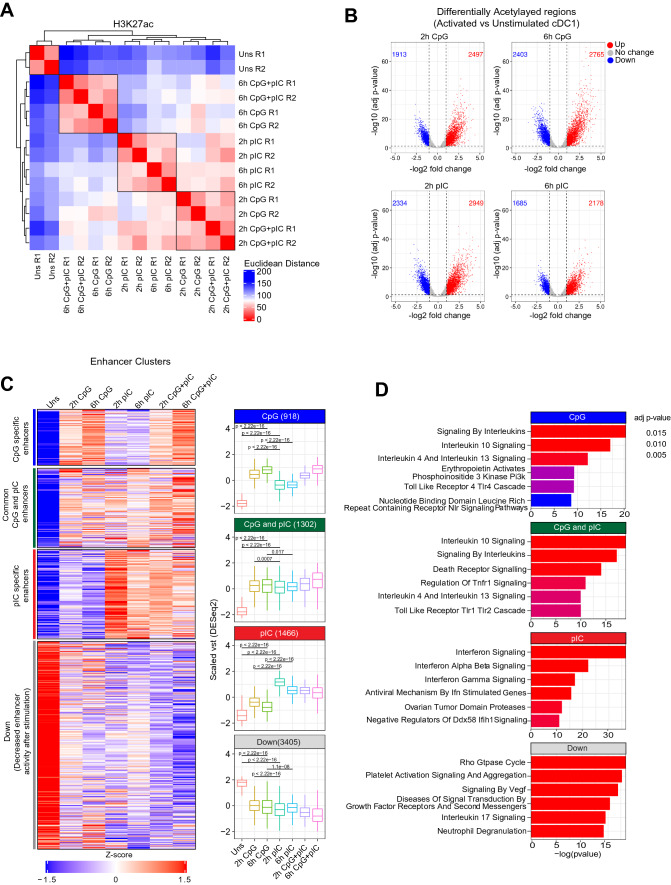
Fig. 2.
Global profiling of H3K27ac histone marks in unstimulated, 2 h and 6 h CpG, pIC and CpG + pIC stimulated cDC1 identified TLR specific active enhancers. A Clustering of H3K27ac marks from two independent biological replicates of unstimulated, 2 h, and 6 h CpG, pIC and combined CpG + pIC stimulated cDC1 based on euclidean distance. B Volcano plot showing differential H3K27ac genomic regions in cDC1 cells after 2 h, and 6 h CpG, and pIC activation as compared to unstimulated condition. C Heatmap (1st panel) representing CpG, pIC and combined CpG + pIC stimulation specific enhancers. Variance stabilized transformed (vst) values were scaled using mean and standard deviation across the samples. Boxplot (2nd panel) representing distribution of scaled vst of H3K27ac enrichment in different conditions. Wilcoxon tests were carried out to compare the difference in mean and to calculate the p value significance between the conditions. D Barplot depicting the enriched reactome pathway from MSigDB database enriched in the activation specific enhancer clusters showing stimulation dependent enhancer activity

