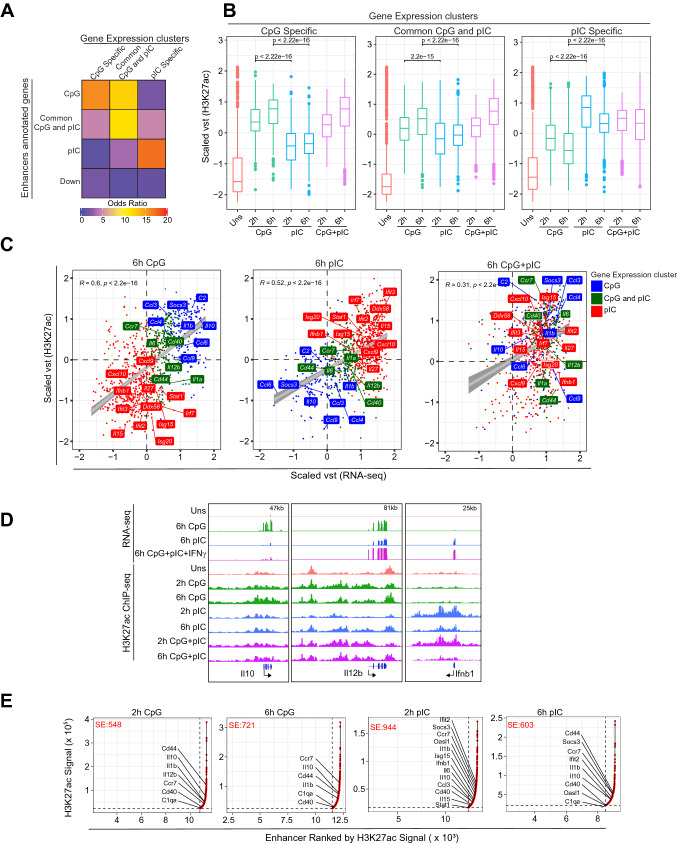
Fig. 3.
Integration of stimulation specific H3K27ac enhancers with global gene expression data in cDC1. A Heatmap showing odds ratio of association of CpG, pIC specific or common CpG-pIC genes with genes annotated to CpG and pIC specific enhancer. B Boxplot showing the scaled vst comparison of H3K27ac ChIP enrichment on CpG, pIC and common CpG-pIC specific genes identified in Fig. 1B. C Scatter plots depicting the correlation of gene expression and H3K27ac enhancer activity in CpG, pIC and CpG + pIC stimulated condition. The CpG, pIC specific and common CpG-pIC genes are highlighted in blue, red and green color respectively and selected representative genes from respective clusters are marked in the plots. D IGV browser snapshot representing RNA-seq and H3K27ac enrichment in unstimulated, CpG, pIC and combined CpG + pIC on Il12b, Il6, Il10 and Ifnb1 gene loci. E Scatter plots showing the Super Enhancers identified at 2 h and 6 h (CpG, pIC) stimulated cDC1. The CpG/pIC specific genes annotated to the Super Enhancer regions have been marked for each condition

