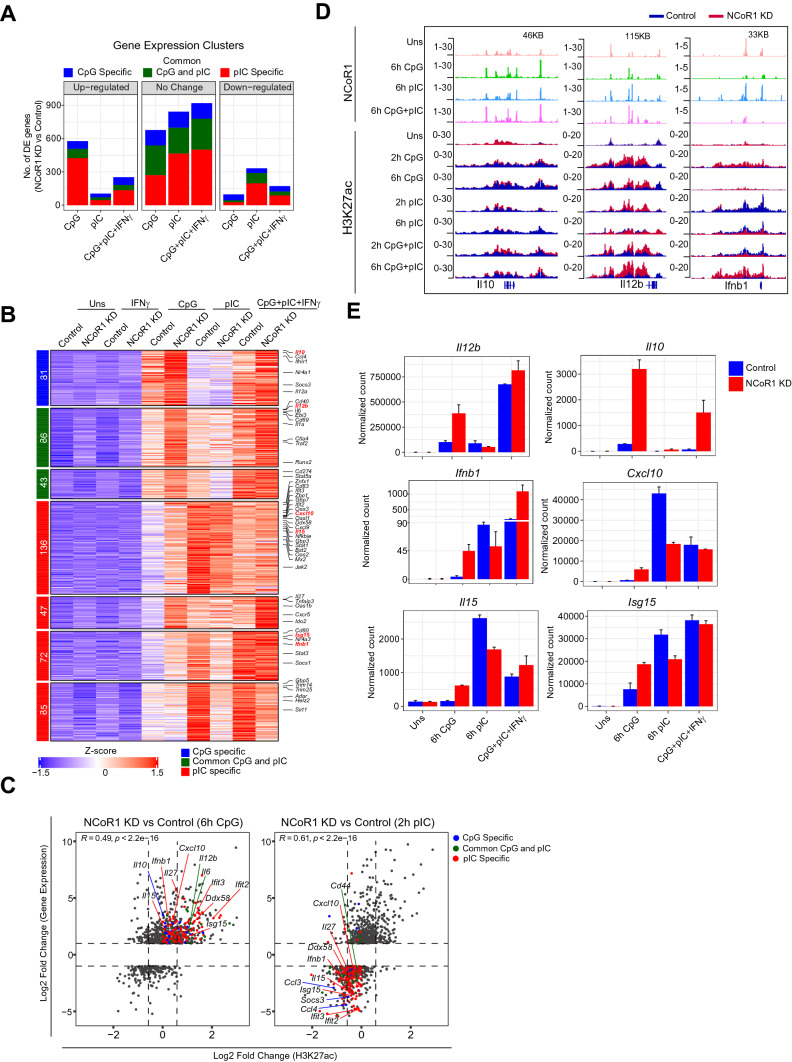
Fig. 5.
Integrative analysis of global scale gene expression, enhancer activity, and NCoR1 binding depicting NCoR1 control on signal specific cDC1 immune responses. A Bar plot showing number of genes that are differentially regulated or unchanged in NCoR1 depleted cDC1 at 6 h CpG, 6 h pIC or common CpG + pIC conditions as compared to the list of genes found to be differentially expressed in 6 h CpG, 6 h pIC and combined CpG + pIC challenged cDC1 versus unstimulated cDC1. B Heatmap clusters demonstrating the activation specific gene expression pattern in 6 h CpG, 6 h pIC and combined 6 h CpG + pIC challenge in control and NCoR1 KD cDC1. Important DC response genes showing signal specific responses are marked. C Scatter plots showing comparison of Log2 fold change in gene expression and corresponding enhancer activity at signal specific genes in CpG and pIC activated condition in NCoR1 depleted condition versus control cDC1 cells. D IGV browser snapshot showing NCoR1 binding enrichment in wild type cDC1 cells and H3K27ac histone mark enrichment in control and NCoR1 KD cDC1 at Il12b, Il10 and Ifnb1 gene loci. E Bar plots showing normalized counts (DESeq2) for selected target genes from RNA-seq data of control and NCoR1 KD cDC1s in unstimulated, CpG, pIC and CpG + pIC + IFNγ stimulation

