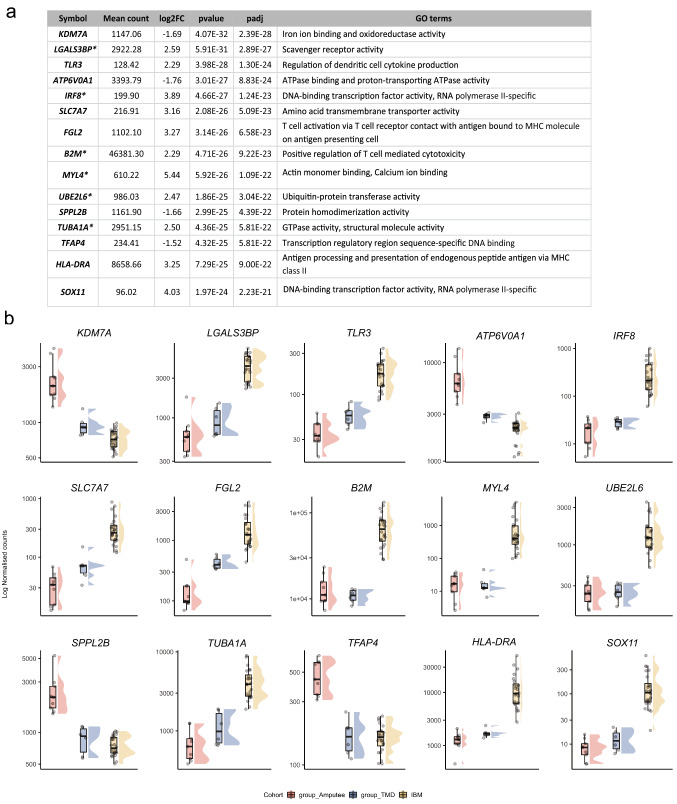
Fig. 2.
a Top 15 differentially expressed genes specific to IBM muscles. Log2 fold change (log2FC) of IBM versus amputees calculated by DEseq2 after shrinkage estimations. ' + '/'−' sign denotes the direction of change, i.e., positive log2FC values indicate overexpressed genes in IBM muscles, and negative log2FC values indicate underexpressed genes in IBM muscles. The p value of significance and adjusted p value using the Benjamini–Hochberg corrections and associated GO terms are shown for each gene. Genes marked with * are also observed as significantly dysregulated in Hamann et al. [13]. b Normalized gene expression in the different cohorts is presented as boxplots. Median and quartile values are shown, with whiskers reaching up to 1.5 times the interquartile range. Individual expression levels are shown as jitter points. The raincloud plots illustrate the distribution of data in each cohort. The scaled Y-axis shows log normalized counts

