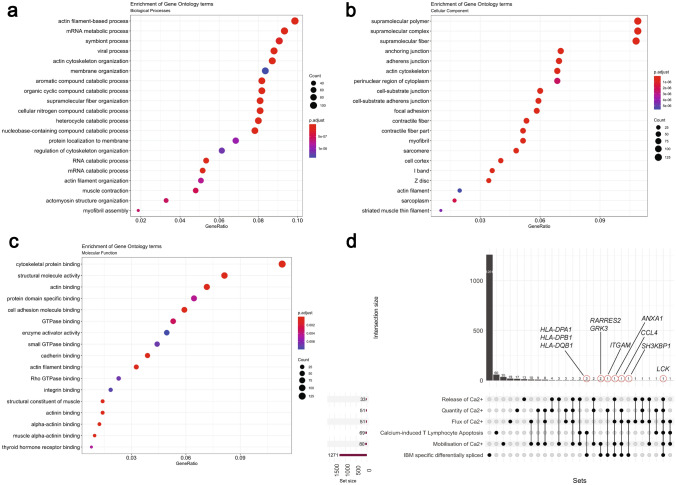
Fig. 4.
Statistical over-representation tests were performed on a list of differentially spliced RNAs, using clusterProfiler for a Biological Processes, b Cellular component, and c Molecular function. d An UpSet plot is shown comparing six different sets, namely, IBM-specific differentially spliced (1271 genes), mobilization of Ca2+ (80 genes), calcium-induced T lymphocyte apoptosis (69 genes), the flux of Ca2+ (51 genes), quantity of Ca2+ (51 genes), and release of Ca2+ (33 genes). Dots and lines represent subsets of different lists. The horizontal bar graph (wine color) represents the size of each set, while the vertical histogram (black) represents the number of RNAs in each subset. The 10 RNAs that are both differentially expressed and differentially spliced are shown with a red circle with their gene names (black)

