Fig. 2.
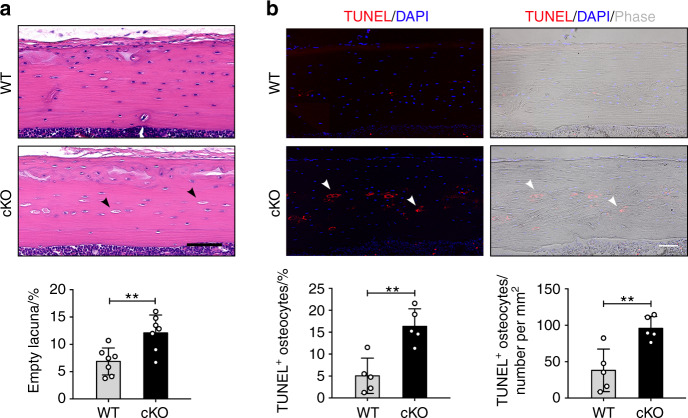
Deletion of integrin α5 in osteocytes increased osteocyte apoptosis and empty lacunae in tibial cortical bone. a Representative H&E images and empty lacunae quantification (black arrows) of tibial midshaft cortical bone in WT and cKO mice. Scale bar: 80 μm. n = 7 per group. b Representative fluorescence images of TUNEL-staining (left upper panels) and corresponding phase images (right upper panels). The TUNEL-positive osteocytes are indicated (white arrows). TUNEL-positive osteocytes were quantified in tibial cortical bone based on total lacunae and bone area (lower panels). Scale bar: 60 μm. n = 5 per group. Mean ± SD. **P < 0.01. Student unpaired t test

