Fig. 5.
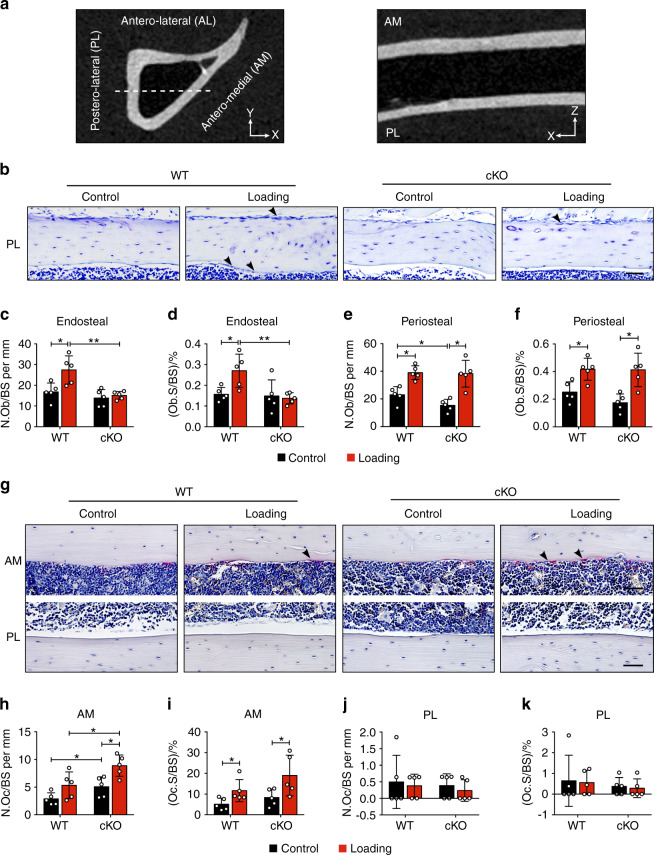
Integrin α5 in osteocytes inhibited loading-induced increase in osteoblast activity. a Gray-scale μCT images of transverse, sagittal sections. The dotted lines showed the locations of sagittal paraffin sections on transverse cross-section of the tibia bone (left panel) and the sagittal image showed the paraffin sections obtained (right panel). b Representative toluidine blue staining showed the osteoblasts on postero-lateral (PL) periosteal and endosteal surfaces of 37% diaphysis, for both loaded and contralateral, unloaded tibias of WT and cKO mice. The representative osteoblasts are indicated (black arrows). Scale bar: 50 μm. Quantification of osteoblast number per bone perimeter (N.Ob/BS) (c, e) and osteoblast surface per bone perimeter (Ob.S/BS) (d, f) on PL endosteal (c, d) and periosteal (e, f) surfaces of 37% diaphysis. n = 5 per group. g Representative images of TRAP-positive osteoclasts (black arrow) on antero-medial (AM) and PL endosteal surfaces of 37% diaphysis, for both loaded and contralateral, unloaded tibias of WT and cKO mice. Scale bar: 50 μm. Quantification of TRAP-positive osteoclast number per bone perimeter (N.Oc/BS) and osteoclast surface per bone perimeter (Oc.S/BS) on AM (h, i) and PL (j, k) endosteal surfaces of 37% diaphysis. n = 5 per group. Mean ± SD. *P < 0.05; **P < 0.01. Paired t test was done for loaded and contralateral tibias and unpaired t test was done for loaded or control tibias between WT and cKO mice

