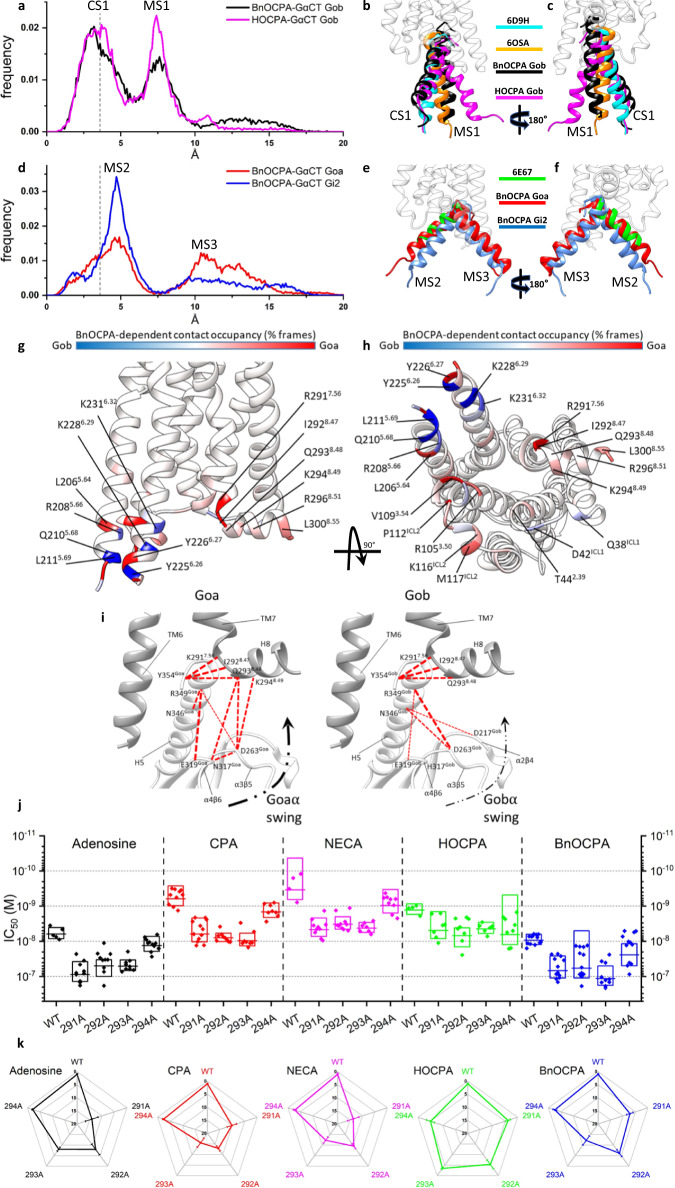
Fig. 4. BnOCPA selectively induces canonical activation states at A1R:Gob, but non-productive metastable states at other Gαi/o subunits.
a–c Dynamic docking of the Gob-GαCT (last 27 residues) performed on the BnOCPA-A1R (black) and the HOCPA-A1R (magenta) complex, respectively. a Frequency distribution of the RMSD of the last 15 residues of Gob-GαCT (alpha carbon atoms) relative to the Gi2-GαCT conformation reported in the A1R structure PDB code 6D9H (dashed grey line indicates 3.6 Å resolution). The two most probable RMSD ranges, canonical state (CS) CS1 and metastable state (MS) MS1, can be observed. b, c Side views of representative MD frames of the most populated α5 clusters from CS1 and MS1. The last 15 residues of Gob-GαCT in CS1 of both BnOCPA and HOCPA resemble the Gi2-bound state (PDB code 6D9H; cyan). MS1 is characterised by a binding geometry similar to the non-canonical Gi intermediate state reported for the neurotensin receptor structure (PDB Code 6OSA; orange). d–f Dynamic docking of the Goa- and Gi2-GαCT (last 27 residues) performed on the BnOCPA-A1R complex. d As for a except Gob was replaced with Goa (red) and compared to Gi2 (blue), with the two most probable RMSD ranges labelled as MS2 and MS3. e, f Side views of representative MD frames of the most populated GαCT clusters from MS2 and MS3. The Goa and Gi2 last 15 residues in MS2 overlap well with the putative Gs intermediate state (PDB code 6E67; green). In MS3, the GαCT helix orients in unique conformations that differ from those previously described. g, h For each residue the interaction plotted on the backbone is the difference between the Goa and Gob occupancies in the presence of orthosteric BnOCPA (% of MD frames in which interaction occurred). BnOCPA/A1R/Goa (inactive coupling) had the tendency to interact more with ICL2, TM3 TM7, and H8 (red), while BnOCPA/A1R/Gob (active coupling) formed more contacts with TM5 and TM6 (blue). i Residues in TM7 and H8 of the hA1R predicted by MD simulations to be of importance to A1R coupling to Goa (left) and Gob (right). j, k Mutations of R2917.56, I2928.47, Q2938.48 and K2948.49 to alanine in the hA1R differentially affect agonist efficacy against stimulated cAMP production. j Data points represent individual IC50 values (n = 5-13 individual experiments), with the mean represented as the horizontal bar and the box limits indicating ±1 SD. k Spider plot summarising data from j. Source data are provided as a Source Data file.

