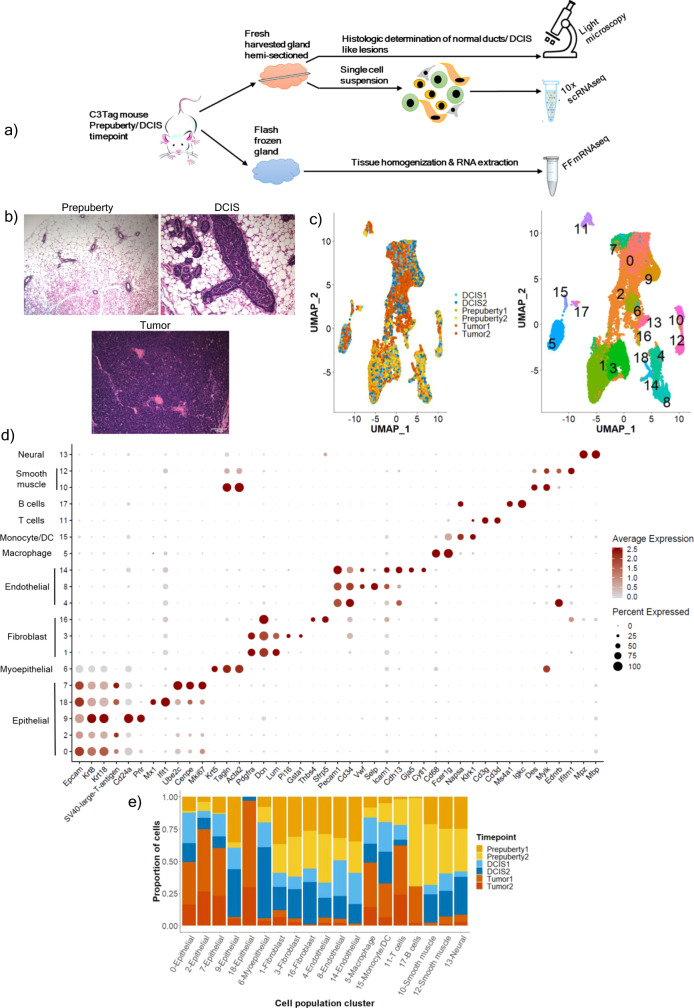
Fig. 1. The overall single-cell RNAseq experimental set up and description of all single-cell populations identified per C3Tag disease stage.
a Schematic of C3Tag experimental strategy to identify MIN/DCIS lesions for downstream scRNAseq and bulk RNA sequencing. b Hematoxylin and Eosin (H&E) stained photomicrographs showing normal C3Tag mammary ducts at prepuberty disease state (×100 magnification), DCIS-like MIN lesions at DCIS disease state (×200 magnification) and mammary tumor cells at tumor disease state (×200 magnification). Scale bars, 100 μm. c UMAP plot of 21,332 single cells in C3Tag mammary colored by the disease state (Left panel) and by the identified cell populations (Right panel). d Dot plot of the expression of specific marker genes across the cell populations identified. e Barplots showing relative contribution of disease state to the identified cell populations [MIN: Mammary intra-epithelial neoplasia; DCIS: Ductal carcinoma in-situ, FF-mRNAseq: Flash-frozen mRNA sequenced]. Source data are provided as a Source Data File 1.

