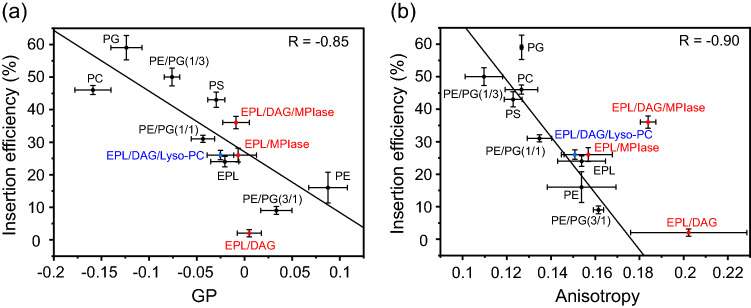
Figure 4.
Correlation between membrane insertion efficiency values (Tables 2 and S1) and Laurdan GP values at 37 °C, , calculated from the emission spectra (Fig. S8) (a), and membrane insertion efficiency values and fluorescence anisotropy values of DPH at 37 °C (Fig. S9) (b) in the various types of membranes. LUVs that are composed of bulk membrane phospholipids are represented by black circles in each figure, whereas red circles represent the LUVs including DAG and/or MPIase. Blue circles represent the LUVs including Lyso-PC. Global linear fits were performed for the bulk phospholipids shown in black.

