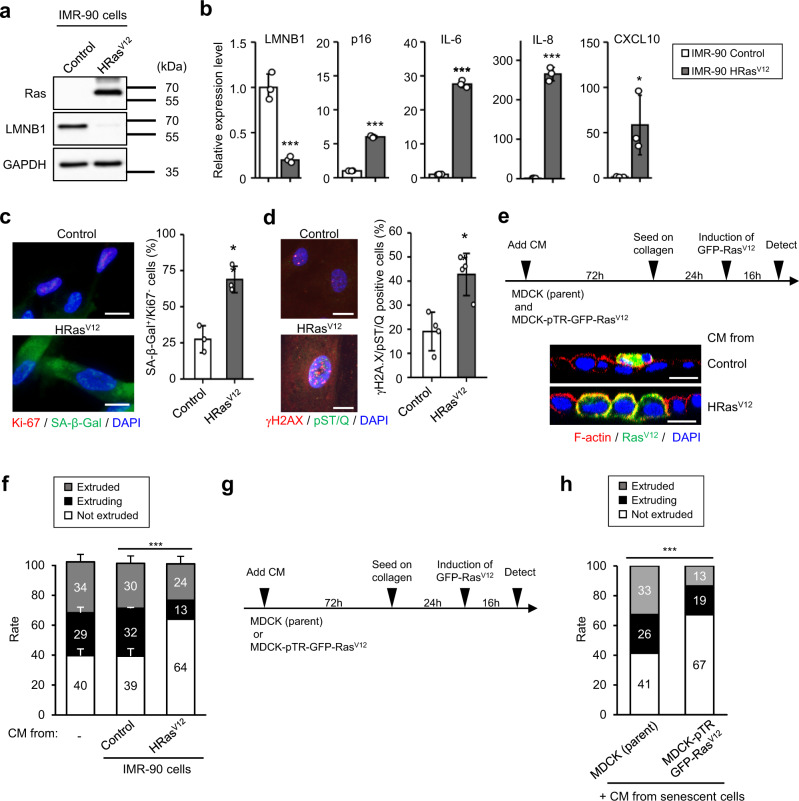
Fig. 1. The secretome from senescent cells suppresses apical extrusion of oncogenic RasV12-expressing MDCK cells from the surrounding normal epithelium.
a–c Presenescent IMR-90 cells were rendered senescent by ectopic expression of oncogenic ras (H-RasV12). These cells were then subjected to western blotting using antibodies shown toward the left (a), RT-qPCR analysis of p16INK4a and SASP factor gene expression (b) (LMNB1, P < 0.001; p16, P < 0.001; IL-6, P < 0.001; IL-8, P < 0.001; CXCL10, P = 0.039), or immunofluorescence staining for markers of senescent cell cycle arrest (Ki-67 (red), SA-β-gal (green) and DAPI (blue), P = 0.007) (c) and DNA damage (γ-H2AX (red), phosphor-Ser/Thr ATM/ATR (pST/Q) substrate (green) and DAPI (blue), P = 0.005) (d). The blotting experiments have performed at least two times (a). Representative data from three independent experiments are shown (b–d). The histograms indicate the percentage of Ki-67-negative and SA-β-gal-positive cells (c) and nuclei containing more than three foci positive for γ-H2AX and pST/Q staining. At least 100 cells were scored per group (c, d). Scale bar, 10 μm. e–h MDCK (parent) and MDCK-pTR GFP-RasV12 cells were separately treated with CM derived from proliferating, or oncogene-induced senescent IMR-90 cells (P < 0.001) (e, f) or CM derived from oncogene-induced senescent IMR-90 cells (P < 0.001) (g, h) for 3 days. The treated MDCK (parent) and MDCK-pTR GFP-RasV12 cells were mixed at a ratio of 50:1 and cultured on type-I collagen gels. These MDCK cells were stained with phalloidin (F-actin, red) and DAPI (blue) after 16 h of incubation with tetracycline to induce RasV12 in MDCK-pTR GFP-RasV12 cells. Representative confocal images of xz sections of RasV12-expressing MDCK cells (green) in a monolayer or normal MDCK cells (e). Scale bar, 10 μm. Quantification of the apically extruded, extruding,or not extruded MDCK-pTR GFP-RasV12 cells from a monolayer of MDCK normal cells (f, h). Representative data from three independent experiments are shown. Error bars indicate the mean ± standard deviation of three independent measurements for all graphs. *P < 0.05, **P < 0.01, or ***P < 0.001 by the unpaired two-sided t test (b–d) or the chi-square test (f, h).

