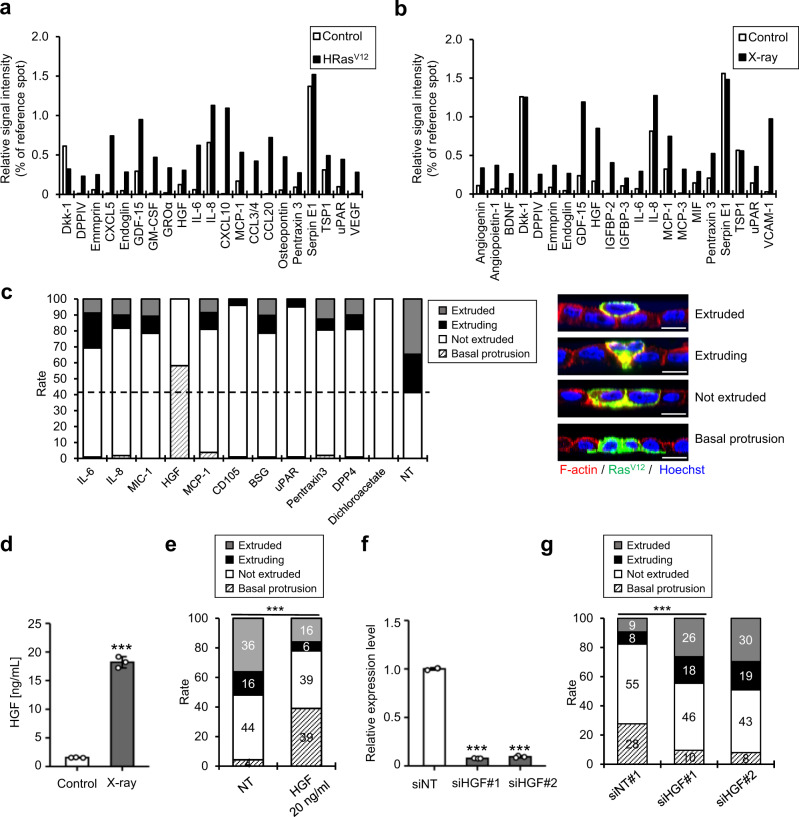
Fig. 2. HGF suppresses apical elimination of RasV12 cells.
a, b Cytokine array analysis of CM derived from oncogene- (a) and X-ray-induced (b) senescent IMR-90 cells (a, b, n = 1). Human cytokine array analysis of multiple cytokines secreted by MDCK-pTR GFP-RasV12 cells after treatment with CM derived from senescent IMR-90 cells. Protein levels are shown as the relative spot intensity (average signal intensity of each spot divided by the control array). c MDCK and MDCK-pTR GFP-RasV12 cells were treated with 250 ng/ml of each recombinant protein or 50 μM dichloroacetate, which suppresses the apical extrusion of RasV12-transformed cells17, for 3 days and mixed at a ratio of 50:1 and cultured on type-I collagen gels. After 16 h of incubation with tetracycline to induce RasV12 in MDCK-pTR GFP-RasV12 cells, quantification of the apically extruded, extruding, not extruded or basally protruded MDCK-pTR GFP-RasV12 cells from a monolayer of MDCK normal cells was performed. NT nontreatment. Scale bar, 10 μm. d Analysis of HGF production in X-ray-induced senescent IMR-90 cells using ELISA. Ten days after senescence induction by 10-Gy irradiation, CM was harvested and subjected to ELISA for HGF production analysis. P < 0.001. e MDCK-pTR GFP-RasV12 cells were treated with 20 ng/ml (control) or 20 ng/ml HGF for 3 days before performing cell competition assay. P < 0.001. f, g Senescent IMR-90 cells induced by oncogenic ras expression were transfected with validated siRNA oligos against HGF twice at 2-day intervals. These cells were then subjected to RT-qPCR for analyzing the expression levels of HGF (f). The relative expression level was normalized by siNT cells (siHGF#1, P < 0.001; siHGF#2, P < 0.001). MDCK and MDCK-pTR GFP-RasV12 cells were treated with CM derived from si control or siHGF-treated oncogene-induced senescent IMR-90 cells for 3 days, mixed at a ratio of 50:1, and cultured on type-I collagen gels. After 16 h of incubation with tetracycline to induce RasV12 in MDCK-pTR GFP-RasV12 cells, quantification of the apically extruded, extruding, or not extruded MDCK-pTR GFP-RasV12 cells from a monolayer of MDCK normal cells was performed (g) (P < 0.001). Representative data from three independent experiments are shown (d, e, g). Error bars indicate the mean ± standard deviation of three independent measurements for all graphs. **P < 0.01, or ***P < 0.001 by unpaired two-sided t test (d), chi-square test (e, g), or one-way ANOVA followed by Dunnett’s multiple comparisons posthoc test (f).

