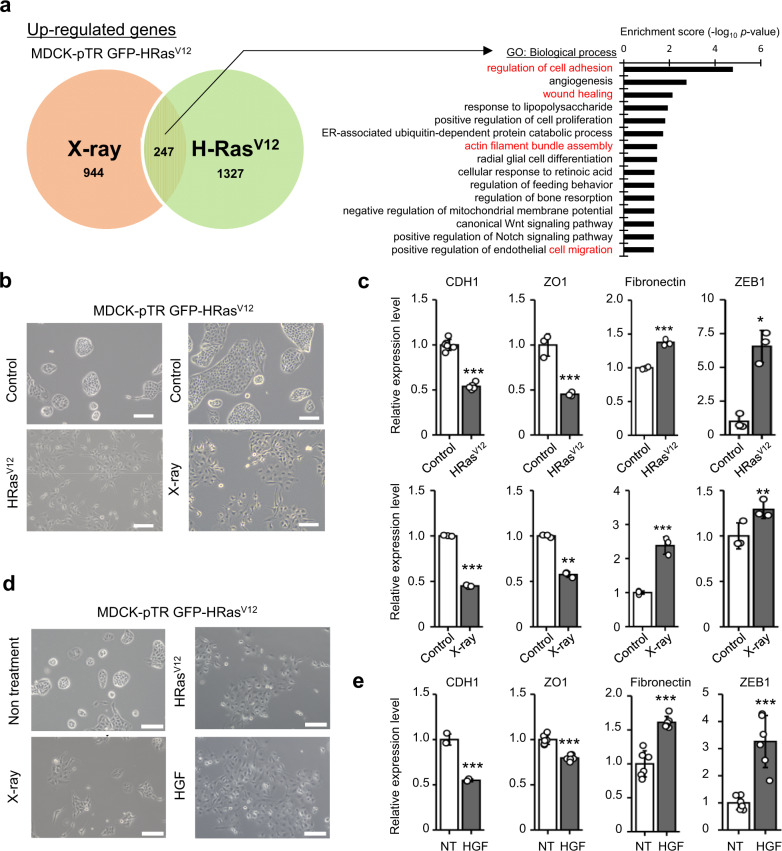
Fig. 3. HGF derived from senescent cells induces EMT of RasV12 MDCK cells.
a Venn diagram indicates upregulated genes that presented at least a twofold significant change in expression in MDCK-pTR GFP-RasV12 cells treated with CM of X-ray- (red) and oncogene-induced senescent IMR-90 cells (green) than in control cells. Out of 2518 genes detected in two samples, 247 were commonly upregulated in both. An enrichment test using GO analysis was performed with those commonly upregulated genes in MDCK-pTR GFP-RasV12 cells. The 15 most enriched terms within the biological process of GO are described in the bar graph. b The appearance of MDCK-pTR GFP-RasV12 cells treated with CM derived from oncogene- or X-ray-induced senescent IMR-90 cells for 24 h. Scale bar, 100 μm. c RT-qPCR analysis of EMT markers in treated MDCK-pTR GFP-RasV12 cells (H-Ras:V12 CDH1, P < 0.001; ZO1, P = 0.0016; fibronectin, P < 0.001; ZEB1, P = 0.0018), (X-ray: CDH1, P < 0.001; ZO1, P < 0.001; fibronectin, P < 0.001; ZEB1, P = 0.044). d The appearance of nontreated MDCK-pTR GFP-RasV12 cells, MDCK-pTR GFP-RasV12 cells treated with CM derived from oncogene-induced senescent IMR-90 cells, X-ray-induced senescent IMR-90 cells, or cells treated with 20 ng/ml HGF for 24 h. Scale bar; 100 μm. e RT-qPCR analysis of EMT markers in MDCK-pTR GFP-RasV12 cells treated with 20 ng/mL HGF (CDH1, P < 0.001; ZO1, P < 0.001; fibronectin, P < 0.001; ZEB1, P < 0.001). CDH1 and ZO1 are shown as epithelial markers (c, e). Fibronectin and ZEB1 are shown as mesenchymal markers (c, e). Representative data from three independent experiments are shown. Error bars indicate the mean ± standard deviation of three independent measurements for all graphs. *P < 0.05, **P < 0.01, or ***P < 0.001 by the unpaired two-sided t test (c, e).

