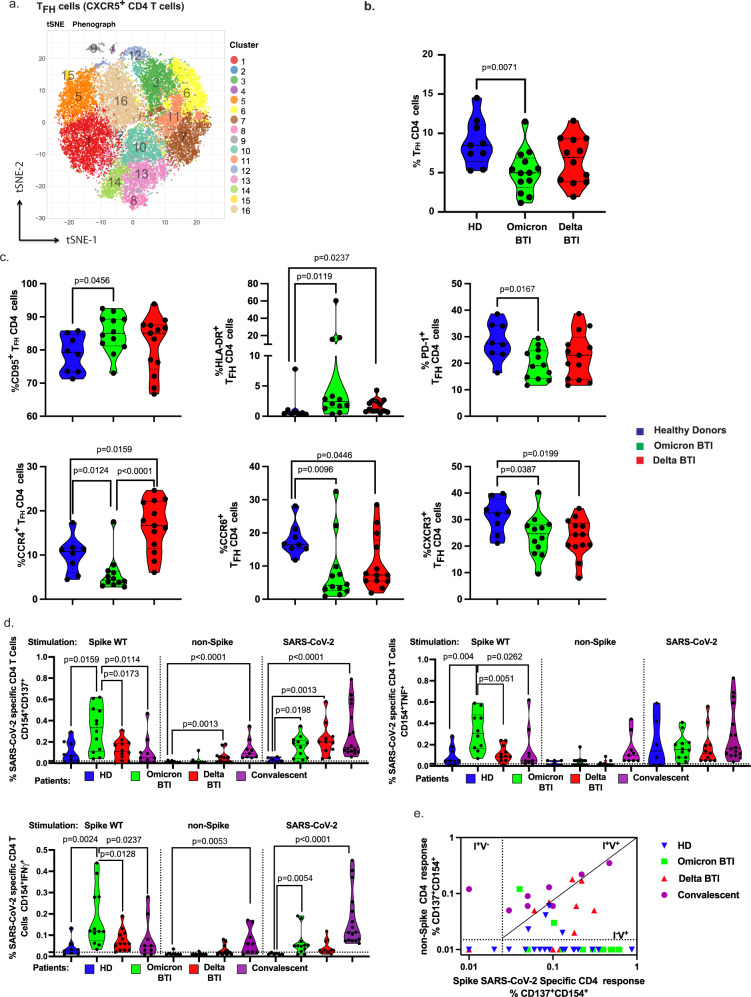
Fig. 2. Th cellular immunity during Omicron and Delta BTI.
Omicron or Delta BTI vaccinated healthy donors or SARS-CoV2 WT convalescents were analyzed to quantify their frequency and characterize the phenotypes of CD4+ TFH cells (a–c) or to assess their functions (e, f). a Mass Cytometry profile of CXCR5+CD4+ Follicular helper T cells. Visualization by tSNE-plot of clusters automatically identified by Phenograph in total TFH from concatenated files of vaccinated HD, Omicron BTI, and Delta BTI (see Methods and Supplementary Fig. 6 legend for details). b The absolute frequency of TFH CD4 T cells in PBMCs for all BTI patients. c Frequency of TFH cells expressing memory (CD95) or activation markers (HLA-DR), PD-1, and chemokine receptors (CCR4, CCR6, CXCR3). d Functional responses of SARS-CoV-2 specific CD4+ T cells. The specific responding CD4+ T cells are shown similarly as in Fig. 1f. e Biplot showing in vitro responses of CD4+ T cells to non-Spike peptide pools vs. Spike-peptides as described28: infected and nonvaccinated (I+V−), non-infected and vaccinated (I−V+); or infected and vaccinated (I+V+). Mann–Whitney test P values are shown for (b–d). See also Supplementary Fig. 6.

