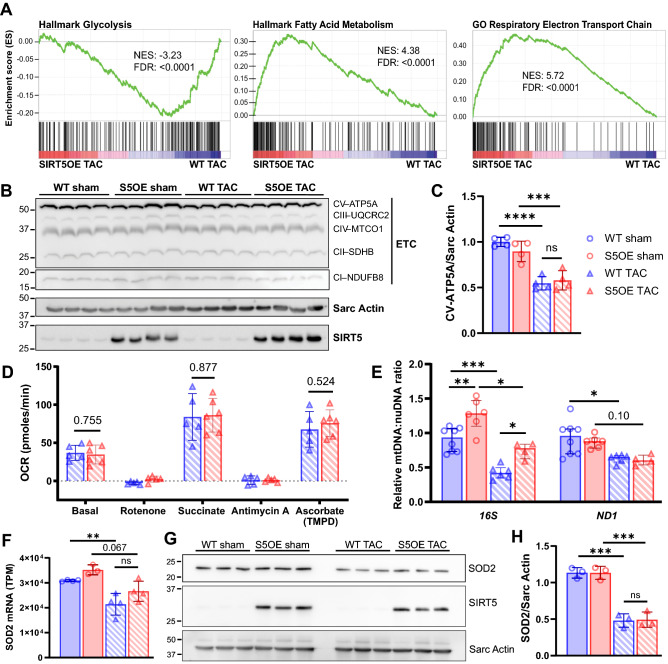
Figure 4.
WT TAC mice exhibit a metabolic shift by RNA-seq, but are functionally comparable to SIRT5OE TAC mice four weeks post-surgery. (A) GSEA of SIRT5OE TAC compared to WT TAC RNA-seq samples. NES: normalized enrichment score. FDR: false discovery rate. (B-C) Immunoblot analysis of electron transport chain subunits and quantification of CV-ATP5A. Original immunoblot images are presented in Supplemental Fig. 8A. (D) Agilent/Seahorse analysis of electron flow through the ETC in mitochondria isolated from WT (n = 5) and SIRT5OE (n = 6) hearts 4 weeks after TAC. y-axis indicates oxygen consumption rate (OCR) in pmol/min. (E) qPCR of mitochondrially encoded (mtDNA) genes 16S and ND1, normalized to HK2, encoded by the nuclear genome (nuDNA). (F) Sod2 mRNA levels measured by RNA-seq. (G-H) SOD2 immunoblot from heart lysates and quantification. Original immunoblot images are presented in Supplemental Fig. 9A.

