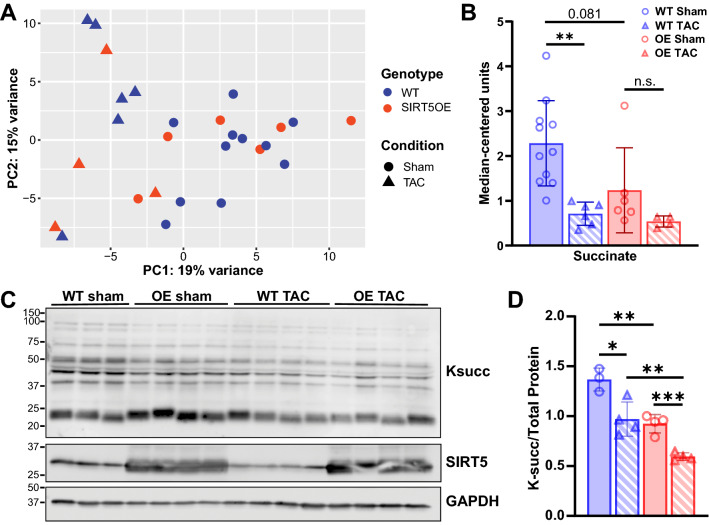
Figure 5.
TAC alters the cardiac metabolomic landscape. (A) PCA of the metabolomics data from hearts four weeks post-surgery across all groups [WT sham (n = 10), WT TAC (n = 6), SIRT5OE sham (n = 6) and SIRT5OE TAC (n = 4)]. (B) Succinate levels. (C-D) Immunoblot analysis of Ksucc in sham and TAC mice, with quantification. Statistical significance was determined using two-way ANOVA followed by Sidak’s correction for multiple comparisons for 4-group analyses. Original immunoblot images are presented in Supplemental Fig. 10A.

