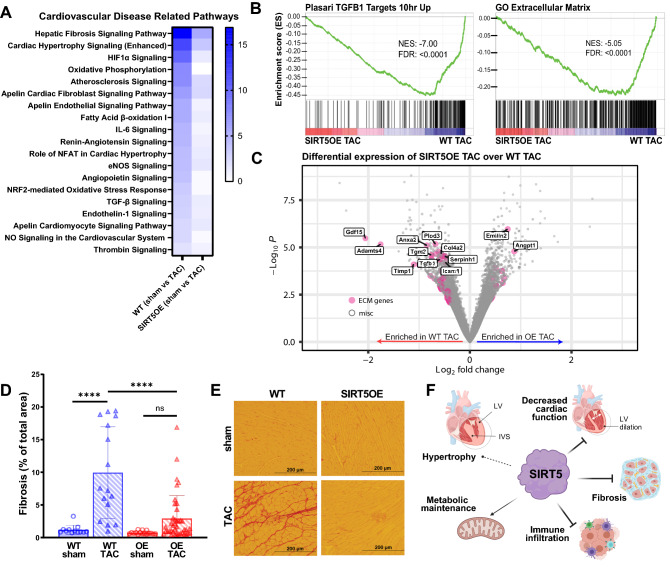
Figure 6.
SIRT5OE protects against TAC-induced fibrosis four weeks after surgery. (A) Heat map of gene ontology analysis of WT (sham vs TAC) and SIRT5OE (sham vs TAC) mapping to cardiovascular disease related pathways using IPA. Blue color scale represents -log(p-value) of each pathway. (B) GSEA of SIRT5OE TAC compared to WT TAC RNA-seq samples. NES: normalized enrichment score. FDR: false discovery rate. (C) Volcano plot highlighting significant genes in from the GO: collagen containing extracellular matrix gene list. (D) Quantification of the amount of fibrosis in each heart sample, expressed in percentage [WT sham (n = 3), WT TAC (n = 4), SIRT5OE sham (n = 4) and SIRT5OE TAC (n = 10)]. Two-way ANOVA interaction term: p-value = 0.0012. (E) Representative images of heart sections stained with Picrosirius red for collagen. (F) Summary figure of effects of SIRT5 overexpression during pressure overload.

