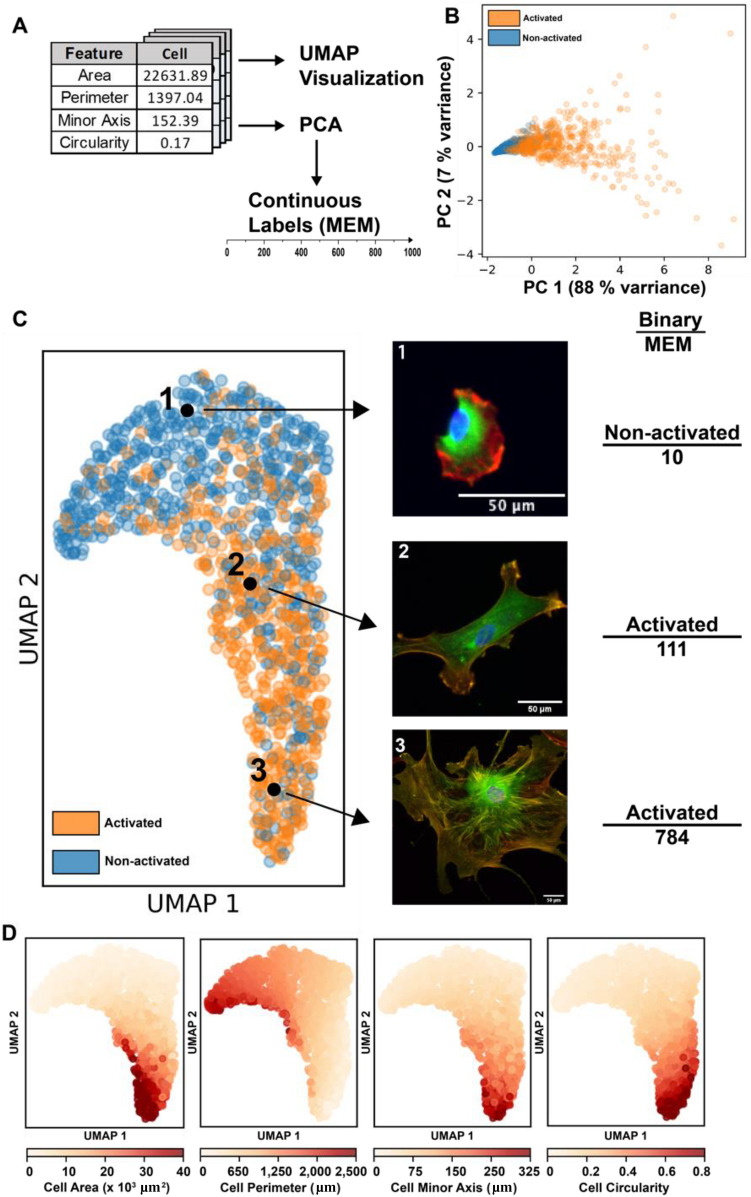
Figure 2.
(A) Overview of the analytical pipeline. Cell feature vectors were first visualized using UMAP, then reduced using PCA and re-scaled to create a continuous label system. (B) 2D PCA reduction of the cell feature vector; PC 1 contained 88% of the variance and was used to create the MEM labels. (C) UMAP reduction of the manually engineered features of all 1104 cells, highlighting cells of different activation levels, with both their binary and MEM label. (D) Labeling the UMAP reduction by cell features (cell area, cell perimeter, cell minor axis, and cell circularity) helps to understand how cells are organized in the reduction.

