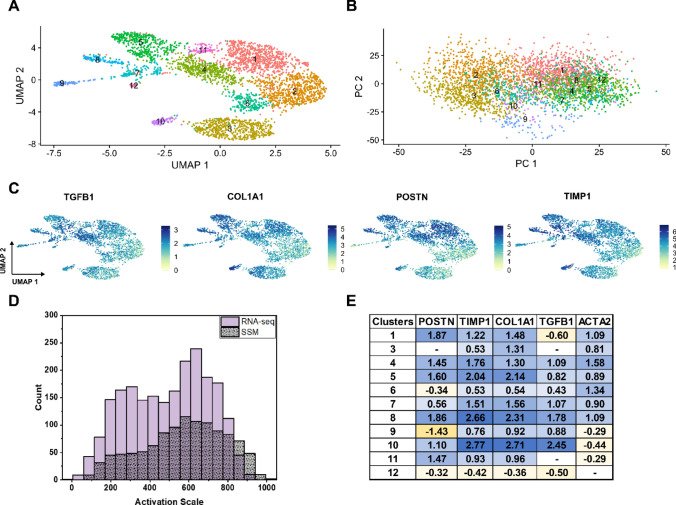
Figure 5.
(A) UMAP reduction of the transcriptomic feature vector for each cell. Clusters were identified by the Suerat software. (B) PCA reduction of the transcriptomic features; individual cells are colored according to their cluster number from (A). (C) Labeling each cell by the expression level of four myofibroblast associated genes (TGFB1, COL1A1, POSTN, and TIMP1) shows a consistent spectrum of activation. (D) Using the PCA reduction, another continuous label system was created. The distribution of cells is similar to that seen from the SSM model. (E) Log2(FC) values of myofibroblast associated genes show that clusters 1, 4, 5, 7, 8, and 10 are highly activated compared to cluster 2.

