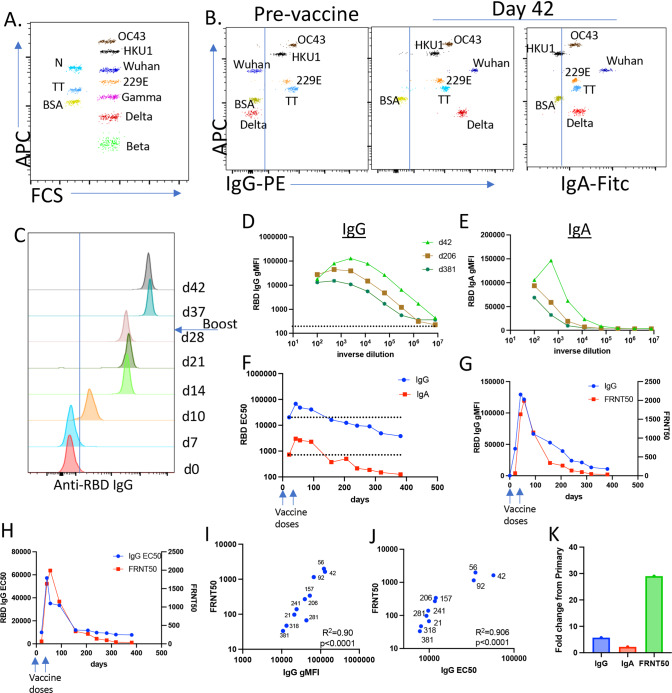
Fig. 2. One year of IgG and IgA antibody titers and antibody-mediated virus neutralization post mRNA-1273 vaccination.
A Representative dot plot of the MMI showing both 5 and 7 um beads, their level of APC fluorescence, and the proteins conjugated to each. B Example data showing both PE (anti-IgG) and FITC (anti-IgA) staining of each bead after incubation with a serum derived from pre- and day 42 post vaccine samples followed by anti-hIgG-biotin/SA-PE and anti-hIgA-FITC. C Histogram offset overlay of anti-RBD IgG staining from day 0 to 42 post vaccination serum samples diluted at 1:2000. D, E Example serial dilutions for IgG (D) and IgA (E) for samples obtained at the indicated time points. F The curves in D and E were used for determining EC50. G, H FRNT50 values for each time point plotted in parallel to anti-RBD IgG gMFI (G) or EC50 (H). I, J Both the gMFI and EC50 were plotted against FRNT50 values for each time point. The R2 of the correlation and the statistical significance for each are shown. Numbers indicate the time point of each data point. K Maximal fold change in IgG and IgA EC50 and FRNT50, between day 21 and the peak of each response post-secondary vaccination (day 42 for IgG and IgA, day 56 for FRNT50).

