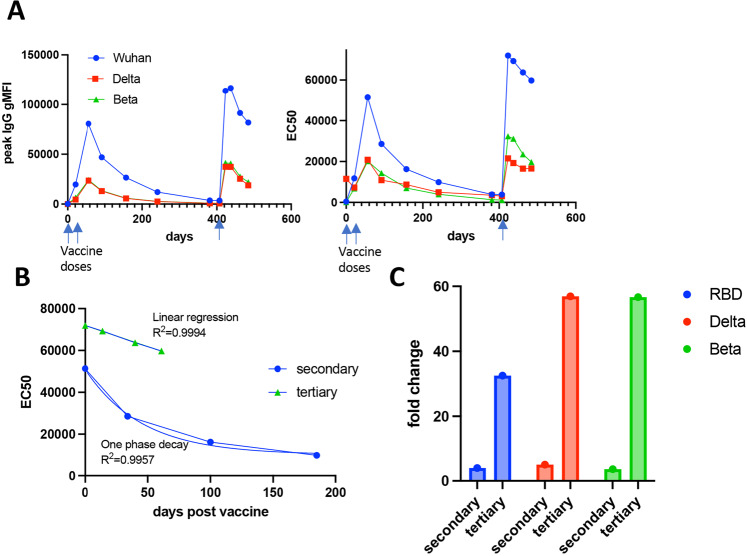
Fig. 4. Comparison between secondary and tertiary antibody response after third dose boost.
A Wuhan, Delta, and Beta RBD-specific IgG levels as measured by gMFI (left) or EC50 (right) after all vaccine doses indicated by the arrow. gMFI is shown from 1:2500 dilution of serum samples. B Decay of antibody levels (from EC50 in A) in the days after the second (blue circles) or third vaccine dose (green triangles). Blue lines track one phase decay (for secondary) or linear (for tertiary) EC50 curve fit. C Fold change in IgG against Wuhan, Delta and Beta as calculated using pre and post secondary immunization gMFI (secondary) and pre and post tertiary immunization gMFI (tertiary).

