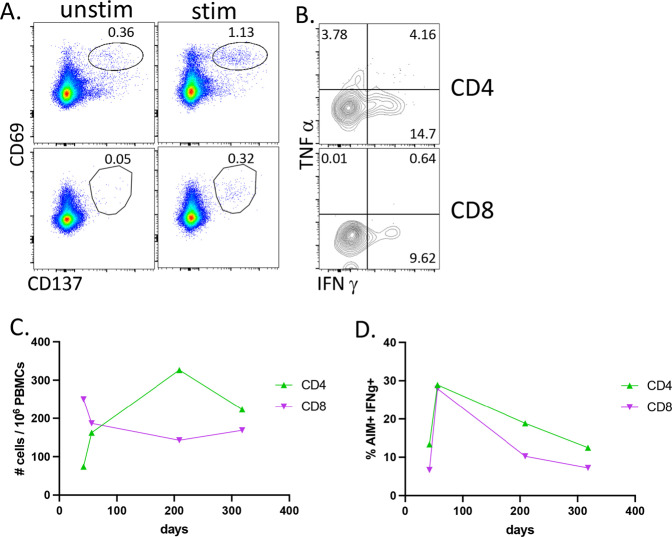
Fig. 5. Longitudinal analysis of T cell responses following mRNA-1273 vaccination.
PBMCs were thawed, rested overnight, then stimulated for 24 h with a peptide library of 15-mer peptides covering the entire RBD domain with 11 amino acid overlaps. For the last 5 h, brefeldin A was added. Cells were then washed, surface stained, fixed, permeabilized, and stained for intracellular cytokines. A T cells at 56 days post vaccination analyzed by flow cytometry for CD69 × CD137 double-positive cells within all live, CD19-, non-naïve (CCR7-), CD4 (top row), or CD8 (bottom row) events. Numbers above gate reflect the percentage of total non-naïve CD4 or CD8 events. B Intracellular cytokine staining of the cells shown on A. C quantification of events as shown in A over time and calculated as # of CD69+ × CD137+ cells per 1 million PBMCs. D Quantification of AIM+IFNγ+ events as shown in B over time.

