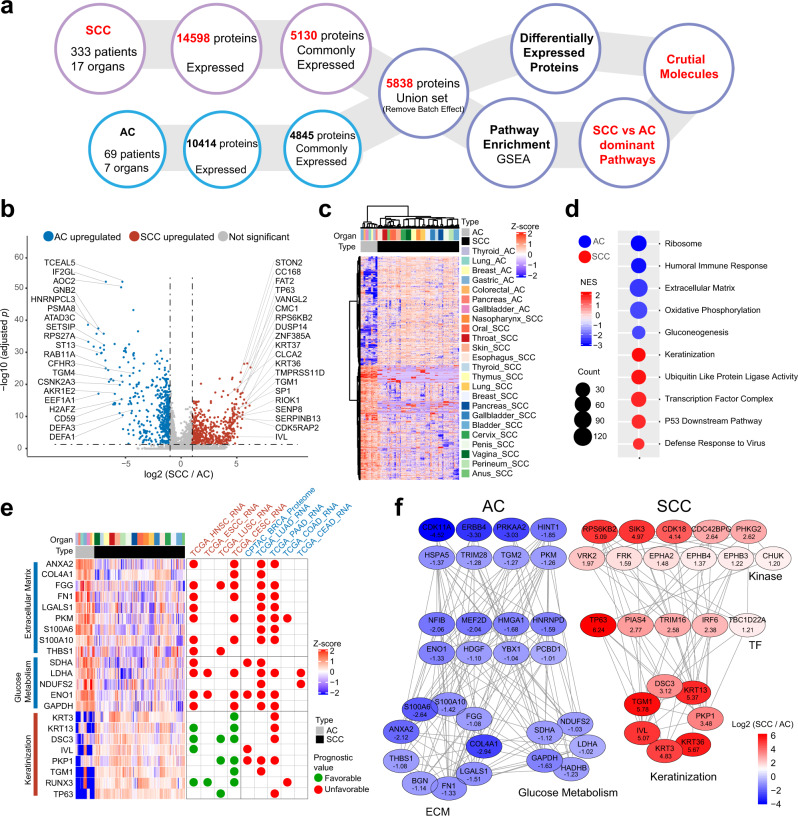
Fig. 2. Proteomic differences of pan-SCCs and pan-ACs.
a The workflow for differential analysis between pan-SCCs and pan-ACs. A total of 5838 proteins commonly expressing in SCCs and/or ACs was obtained and differentially expressed proteins were calculated (Wilcoxon rank-sum test), and Gene set enrichment analysis (GSEA) was performed. b, c A volcano plot and a heatmap showed the results of a two-sided Wilcoxon rank-sum test (BH-adjusted p < 0.05, fold change > 2) comparing pan-ACs and pan-SCCs. Significantly differentially expressed proteins were labeled in the volcano plot. d GSEA revealed the pathways that were significantly enriched in pan-ACs and pan-SCCs. NES, normalized enrichment score. e The prognostic value of differentially expressed proteins in pan-AC-enriched pathways (extracellular matrix and glucose metabolism) and pan-SCC enriched pathway (keratinization) by exploring pan-SCC cohort (this study) and 9 TCGA datasets. P values of pan-SCC cohort were from multivariate Cox proportional hazard model (including age, gender, TNM stage, protein expression, organ, and histology), and p values for 9 TCGA datasets were from log-rank test. f The regulation network of kinases, TFs, and DEPs in pan-ACs and pan-SCCs. All kinases, TFs, and DEPs were colored by log2 (SCC/AC).

