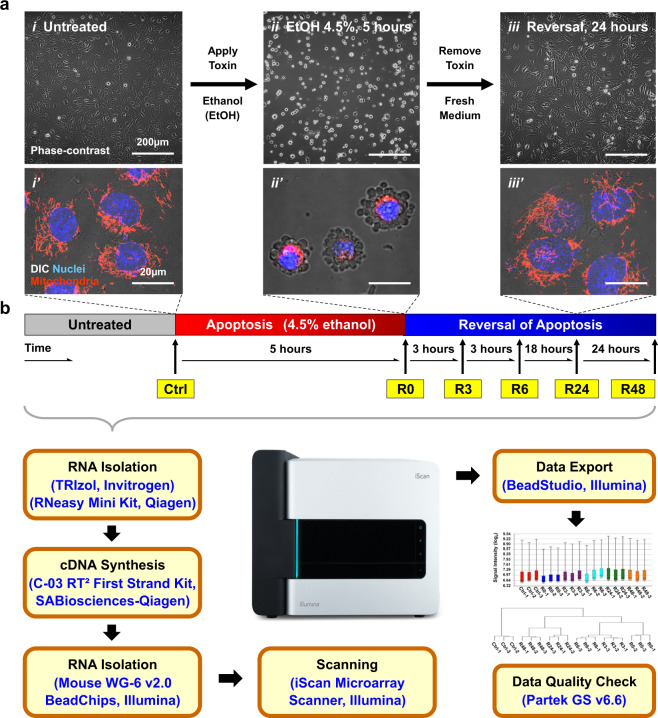
Fig. 1.
Overview of experimental design and study workflow. (a) Reversal of ethanol-induced apoptosis in mouse primary liver cells in νitro served as a model for this microarray study. Phase-contrast images of (i) untreated cells, (ii) cells undergoing apoptosis triggered by 4.5% ethanol (EtOH) for 5 hours, and (iii) ethanol-treated cells washed with and then incubated in fresh medium for 24 hours. (i’-iii’) Merged confocal images, with conditions like i-iii, for visualizing mitochondria (red), nuclei (blue), and cell morphology (DIC). (b) An outline of the workflow for the time-course microarray study. Mouse primary liver cells were treated with 4.5% ethanol for 5 hours to induce apoptosis (R0), and then were washed with and further incubated in fresh culture medium for 3 hours (R3), 6 hours (R6), 24 hours (R24), and 48 hours (R48) to allow reversal of apoptosis. Untreated cells served as control (Ctrl). Cell samples of three biological replicates from each condition mentioned above were collected for RNA extraction, analysed using Illumina Mouse WG-6 v2.0 Expression BeadChip for whole-genome expression profiling, and performed quality check by Partek Genomics Suite (GS) v6.6.

