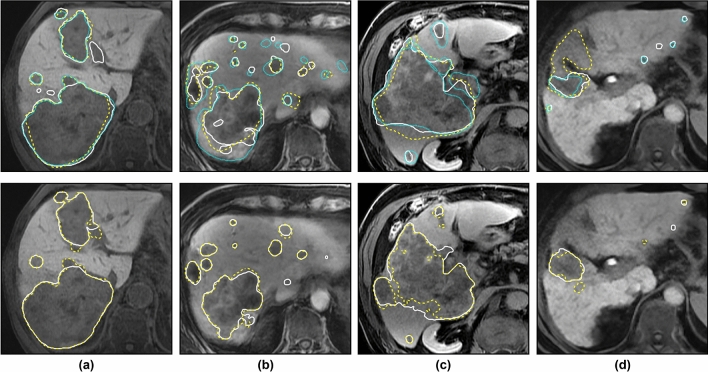
Figure 3.
Exemplary test cases with manual and automatic liver tumor segmentations. Reference segmentations (top row) and automatic segmentation results (bottom row) are shown for test cases 13, 17, 14 and 10 (left to right) in Fig. 2. In the top row, white solid / yellow dashed / cyan finely dotted contours correspond to raters / / . In the bottom row, white solid / yellow dashed contours correspond to algorithms / . Based on the average performance of against all raters , these cases represent the (a) upper, (b, c) median, and (d) lower end of the Dice score range, not including outlier case 4.

