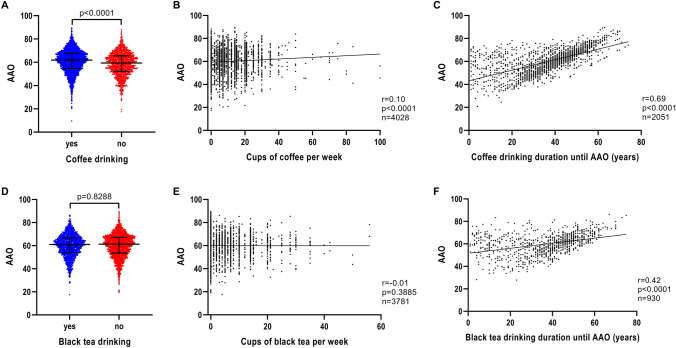
Fig. 2.
Association of AAO and caffeine consumption, caffeine drinking intensity and caffeine drinking duration in iPD. a Scatter plot of AAO of patients with iPD stratified by coffee consumption. Median values and interquartile ranges (IQR) are depicted. b Correlation between number of cups of coffee per week and AAO of patients with iPD. c Correlation between number of years of coffee drinking until AAO and AAO of patients with iPD. d Scatter plot of AAO of patients with iPD stratified by black tea consumption. e Correlation between number of cups of black tea per week and AAO of patients with iPD. f Correlation between number of years of black tea drinking until AAO and AAO of patients with iPD. p value: exploratory Mann–Whitney U test was performed for pairwise comparisons; non-parametric Spearman correlation and simple linear regression analyses were used to assess interactions between variables; p = Spearman’s exploratory p value, r = Spearman’s rank correlation coefficient

