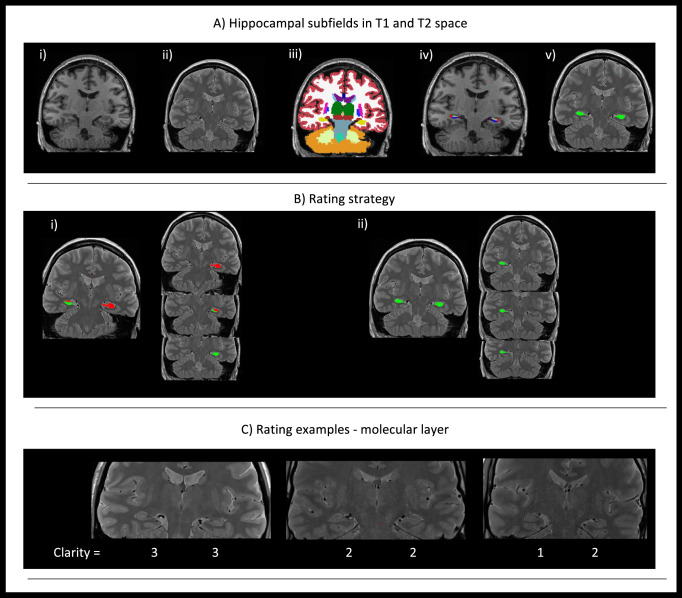
Fig. 2.
Pipeline for molecular layer clarity rating. A The T1 (i) and T2-weighted (ii) images are shown for one subject. In (iii) the outcome of the recon-all Freesurfer pipeline is shown followed by an overlay of the generated hippocampal subfields based on both T1 and T2-weighted scans (iv). In (v) the head-body-tail segmented hippocampus has been registered to the T2 space and is used as a guide for the subsequent molecular layer rating. In B the three rated slices per hemisphere are shown based on the slices starting from the one where the hippocampal body is the majority of the slice. For this particular subject all slices have been rated with a ‘3’ in a scale of 1–3. In C rating examples are shown. A three is assigned when the molecular layer is clearly seen in 80% of the slice and the contrast is satisfactory. A two is assigned when less than 80% is seen or if the contrast is not satisfactory and the molecular layer not clearly seen. A one is assigned when most of the molecular layer is not seen and the contrast is too poor

