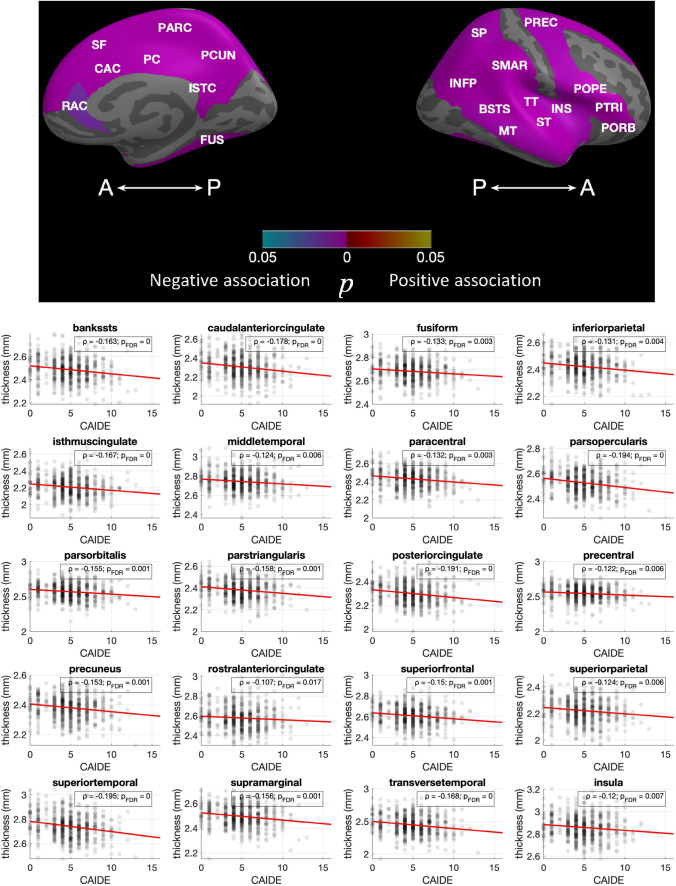
Fig. 3.
Associations of CAIDE with regional thickness. All the identified associations were negative. The overlayed p-values are based on the conducted Spearman correlations and are FDR corrected at a level of p < 0.05.pFDR values lower that 0.001 are shown as 0. Scatterplots with cortical thickness on the y axis and CAIDE on the x axis are shown with a linear fitting. Overlayed are the ρ coefficients along with the FDR corrected p-values. Abbreviations: BSTS, bank of STS; CAC, caudal anterior cingulate; FUS, fusiform; INFP, inferior parietal; INS, insula; ISTC, isthmus cingulate; MT, middle temporal; PARC, paracentral lobule; PC, posterior cingulate; PCUN, precuneus; POPE, Pars opercularis; PORB: Pars orbitalis; PREC, precentral; PTRI, Pars triangularis; RAC, rostral anterior cingulate; SF, superior frontal; SMAR, supramarginal; SP, superior parietal; ST, superior temporal; TT, transverse temporal. freesurfer_statsurf_display was used to visualize statistical results on the brain surface

