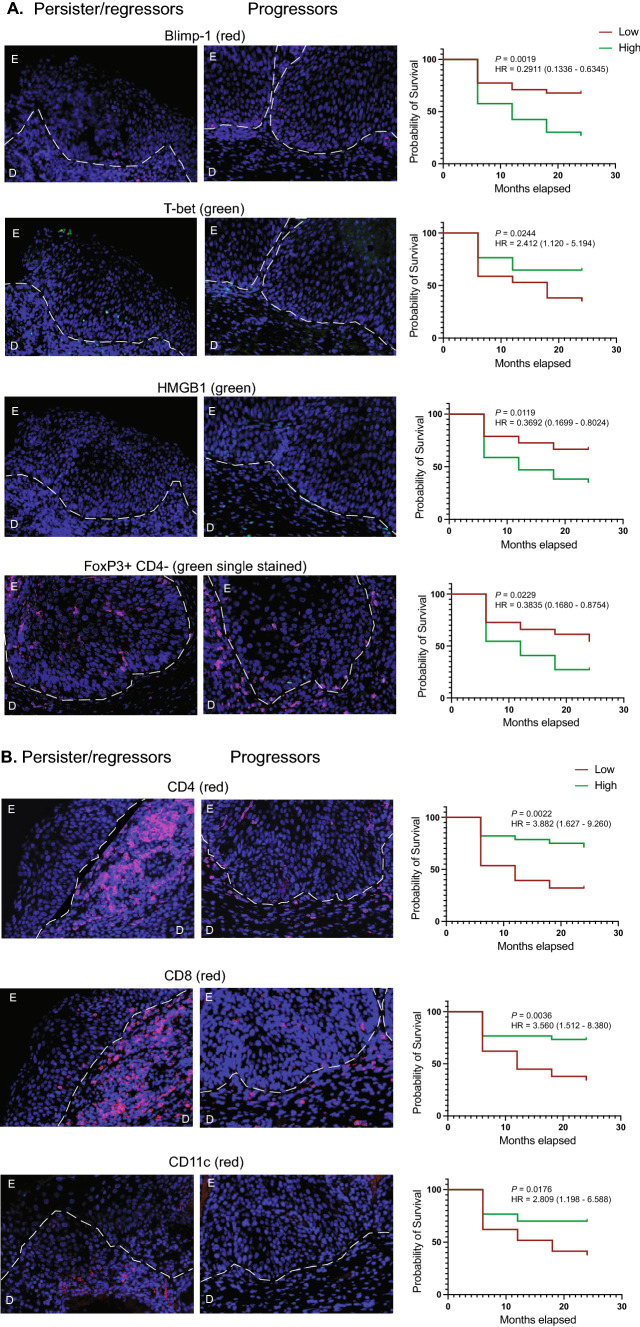
Fig. 2.
Survival curves for significant markers. Markers that were identified as significantly different in the univariate analysis underwent survival analysis. Counts data were defined as categorical into low (below the population median) or high (above the population median) and survival curves were calculated. Low or high representative images are shown for each survival curve. Images and graphs for lesional staining (A) and for staining in the dermal region beneath the lesion (B) are shown

