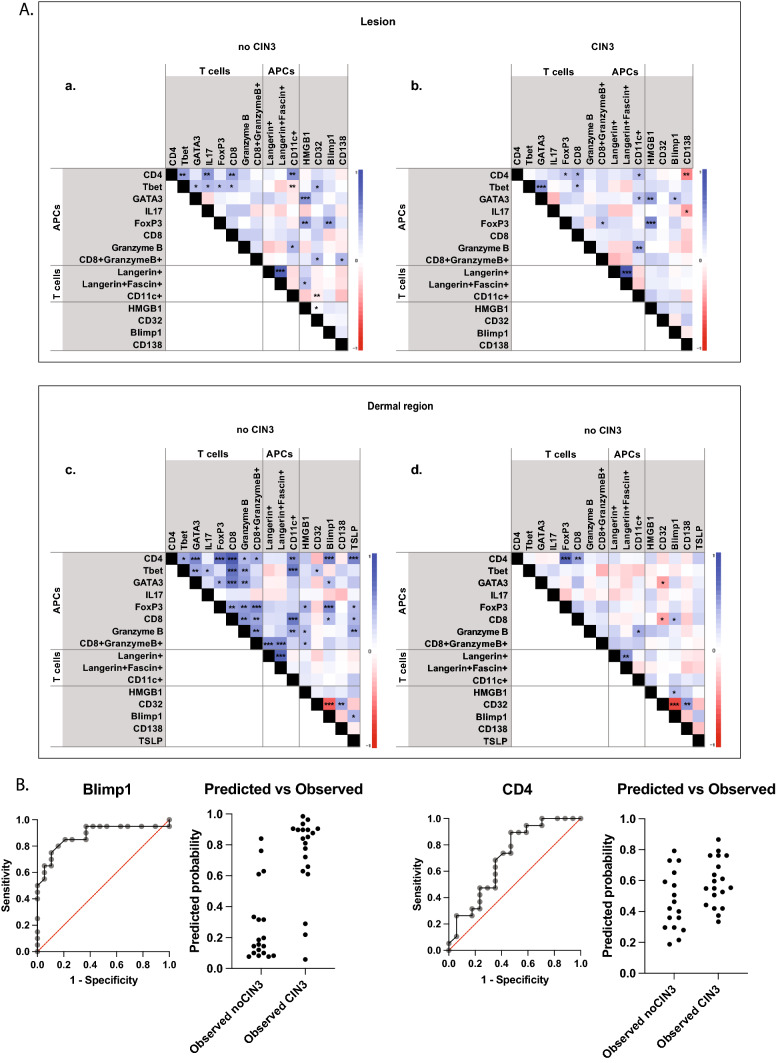
Fig. 3.
(A) The correlation heat map representing r values generated from a Spearman’s correlation of the markers with each other for the positive cells in epidermis site for (A) no CIN3 and (B) CIN3 cases, and in dermis site for (C) no CIN3 and (D) CIN3 cases. P values are shown on each matrix: *P < 0.05; **P < 001; ***P < 0.001. (B) ROC curves and predicted versus observed graphs for lesional Blimp-1 and CD4 + cells in the dermal region beneath the lesion

