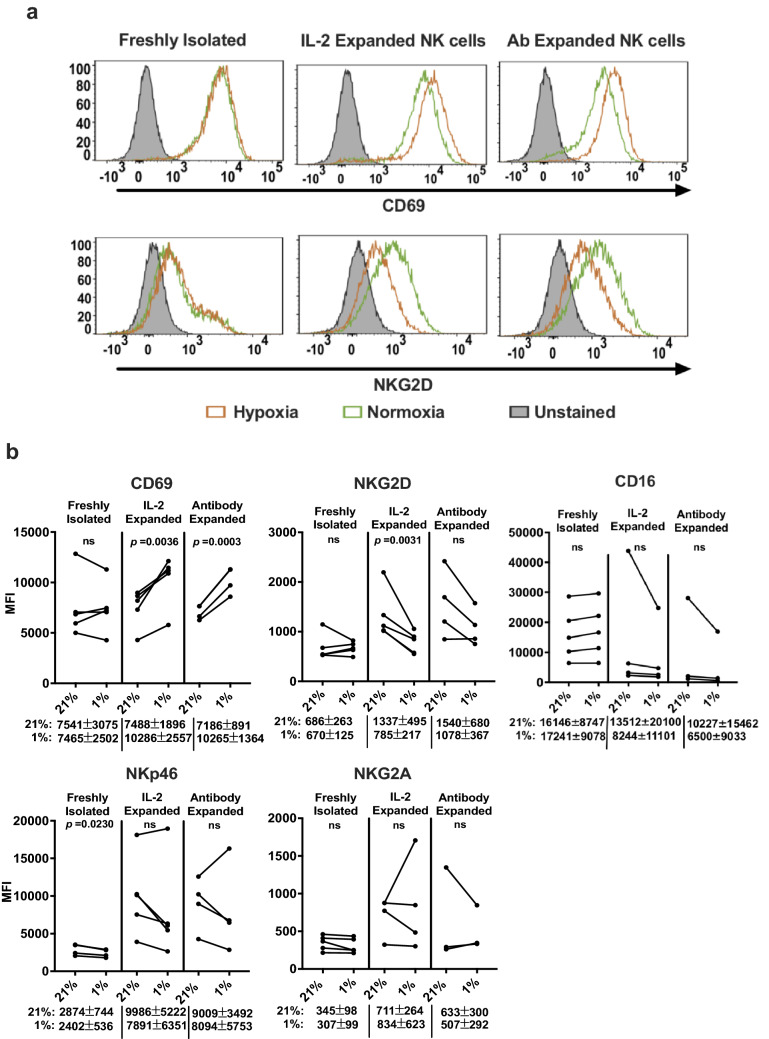
Fig. 6.
Characterization of NK cell receptors on PBMC-derived NK cells in hypoxia. Freshly isolated NK cells and ex vivo expanded NK cells were stimulated with IL-2 and incubated in 21% O2 or 1% O2 for 72 h. Expression of surface receptors was analyzed by flow cytometry as described in “Materials and methods.” a Representative histograms of CD69 and NKG2D expression on freshly isolated NK cells, IL-2-expanded NK cells, and antibody-expanded NK cells. b Median fluorescence intensity (MFI) of the surface receptors expressed on NK cells isolated from various donors is shown in the graph. The average median fluorescence intensities ± SEM of the surface receptors for each NK cell type exposed to normoxia or hypoxia are shown below the graphs. Statistical significance was analyzed between normoxia and hypoxia by a paired two-tailed Student’s t-test. p ≤ 0.05 is significant. NK cells isolated from a minimum of four donors were used for this analysis

