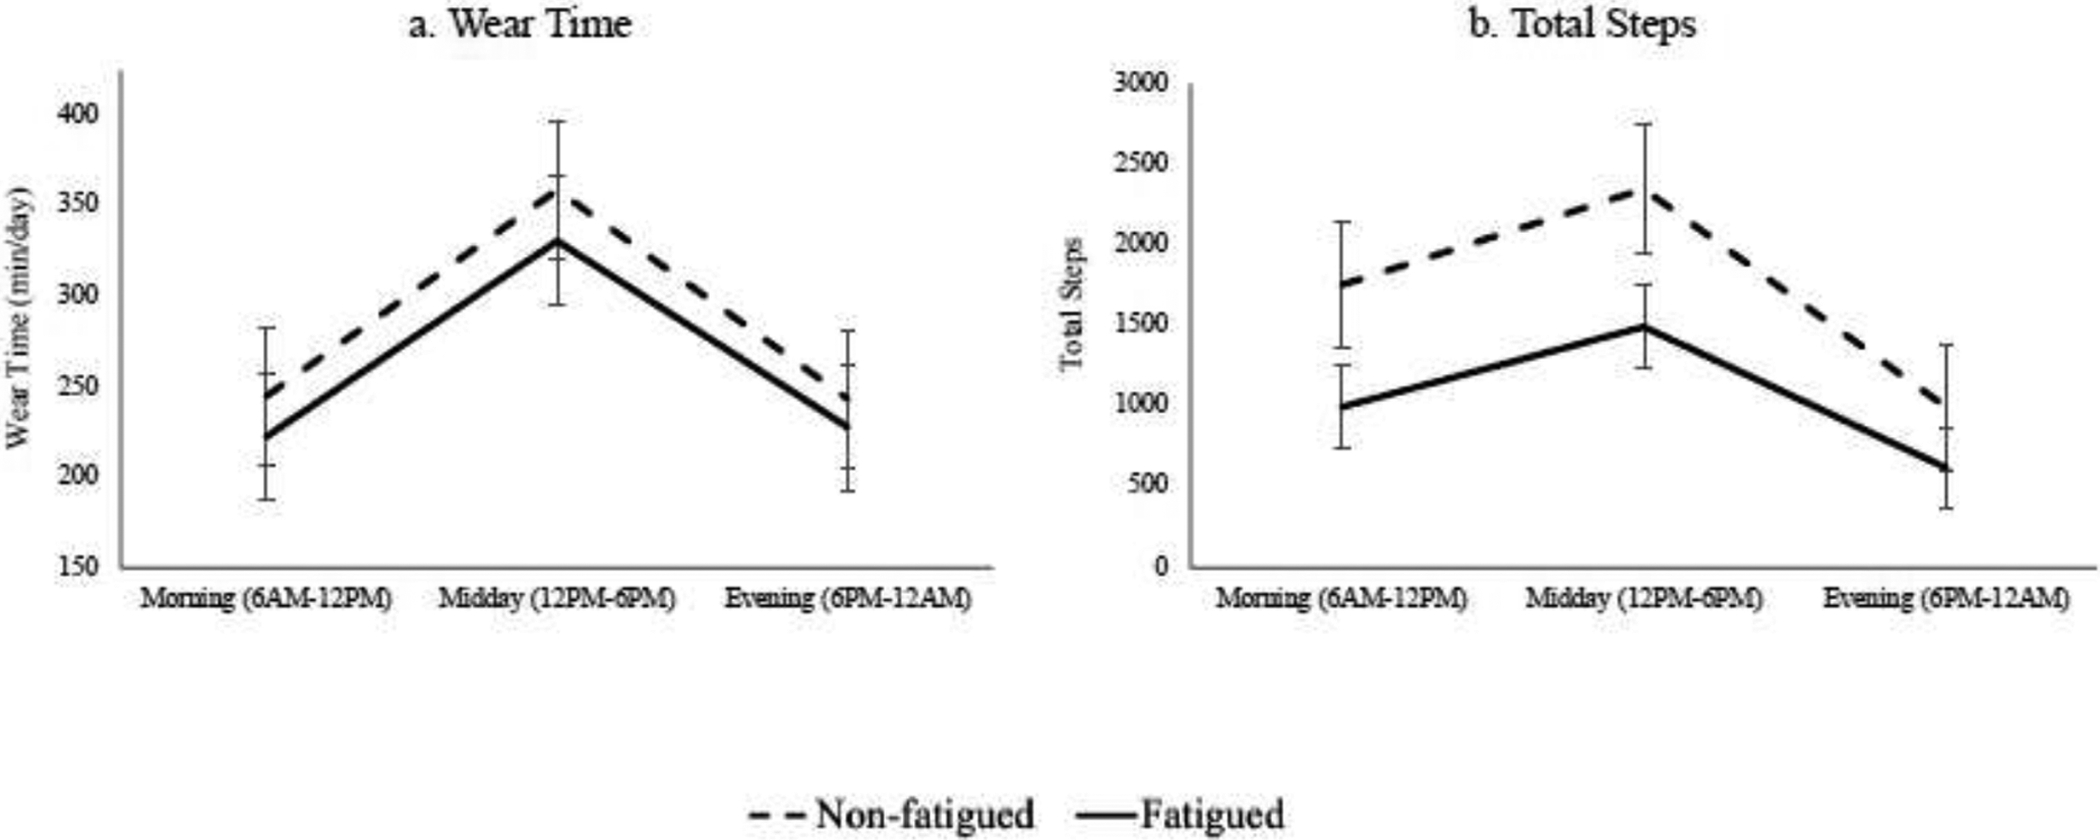
Figure 1: Wear time and step counts during different times of day in adults with multiple sclerosis based on fatigue severity groups. Values are mean and standard error of the mean.

Accelerometer data during different times of day in adults with multiple sclerosis separated into fatigued (solid line) and non-fatigued (dashed line) groups. Figure 1a represents the total accelerometer wear time in minutes and Figure 1b represents total step counts during each time of day. Values are mean and standard error of the mean.
