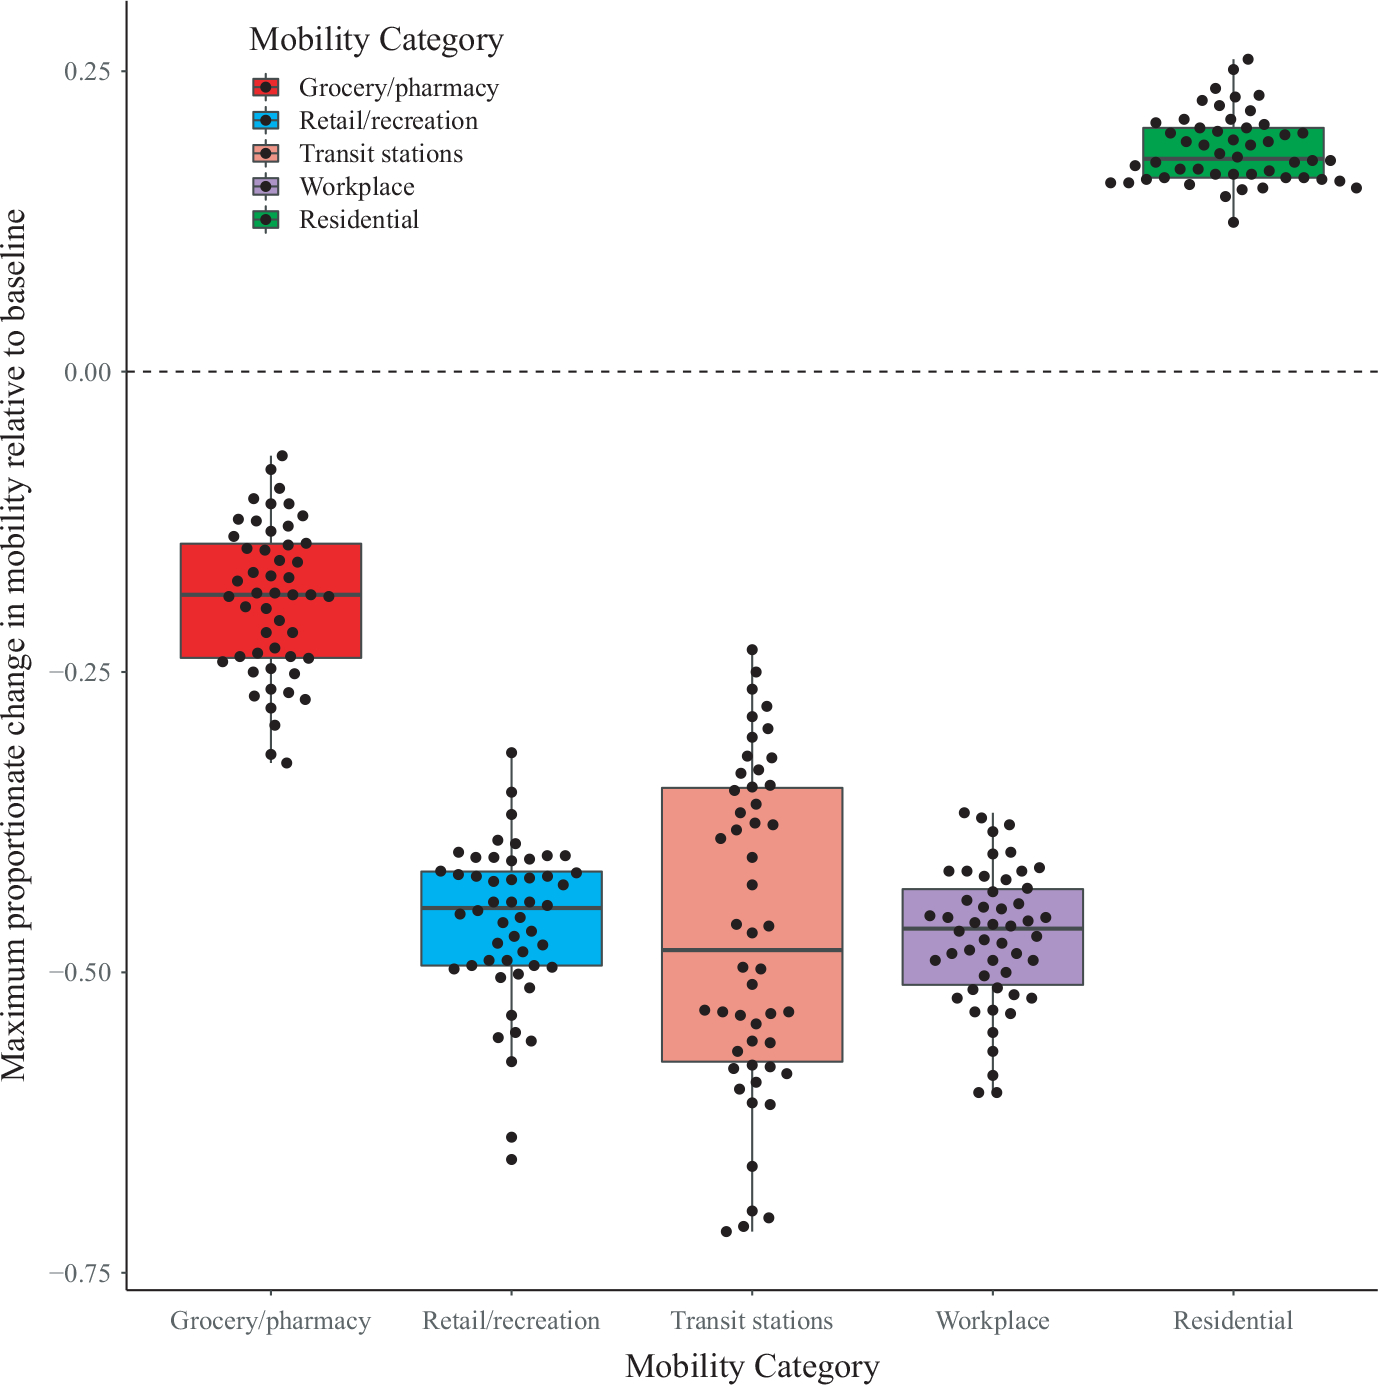
FIGURE 1.

Maximum proportional change in mobility compared with baseline (baseline = 0) achieved by each state, over the course of the study period (29 February-30 April 2020). Each data point represents the value for one state, and box and whisker plots compare the distribution of values among states within each mobility category. Mobility was measured as one of five categories based on the type of locations used by the public: grocery and pharmacy locations, retail and recreation locations, transit stations, workplaces and residential areas (e.g. houses and apartments). Residential mobility increased over the course of the study period (positive values relative to baseline), while all other mobility categories decreased (negative values relative to baseline). Note: Parks were not included in this figure because mobility around parks was highly variable and fluctuated erratically over time for all states
