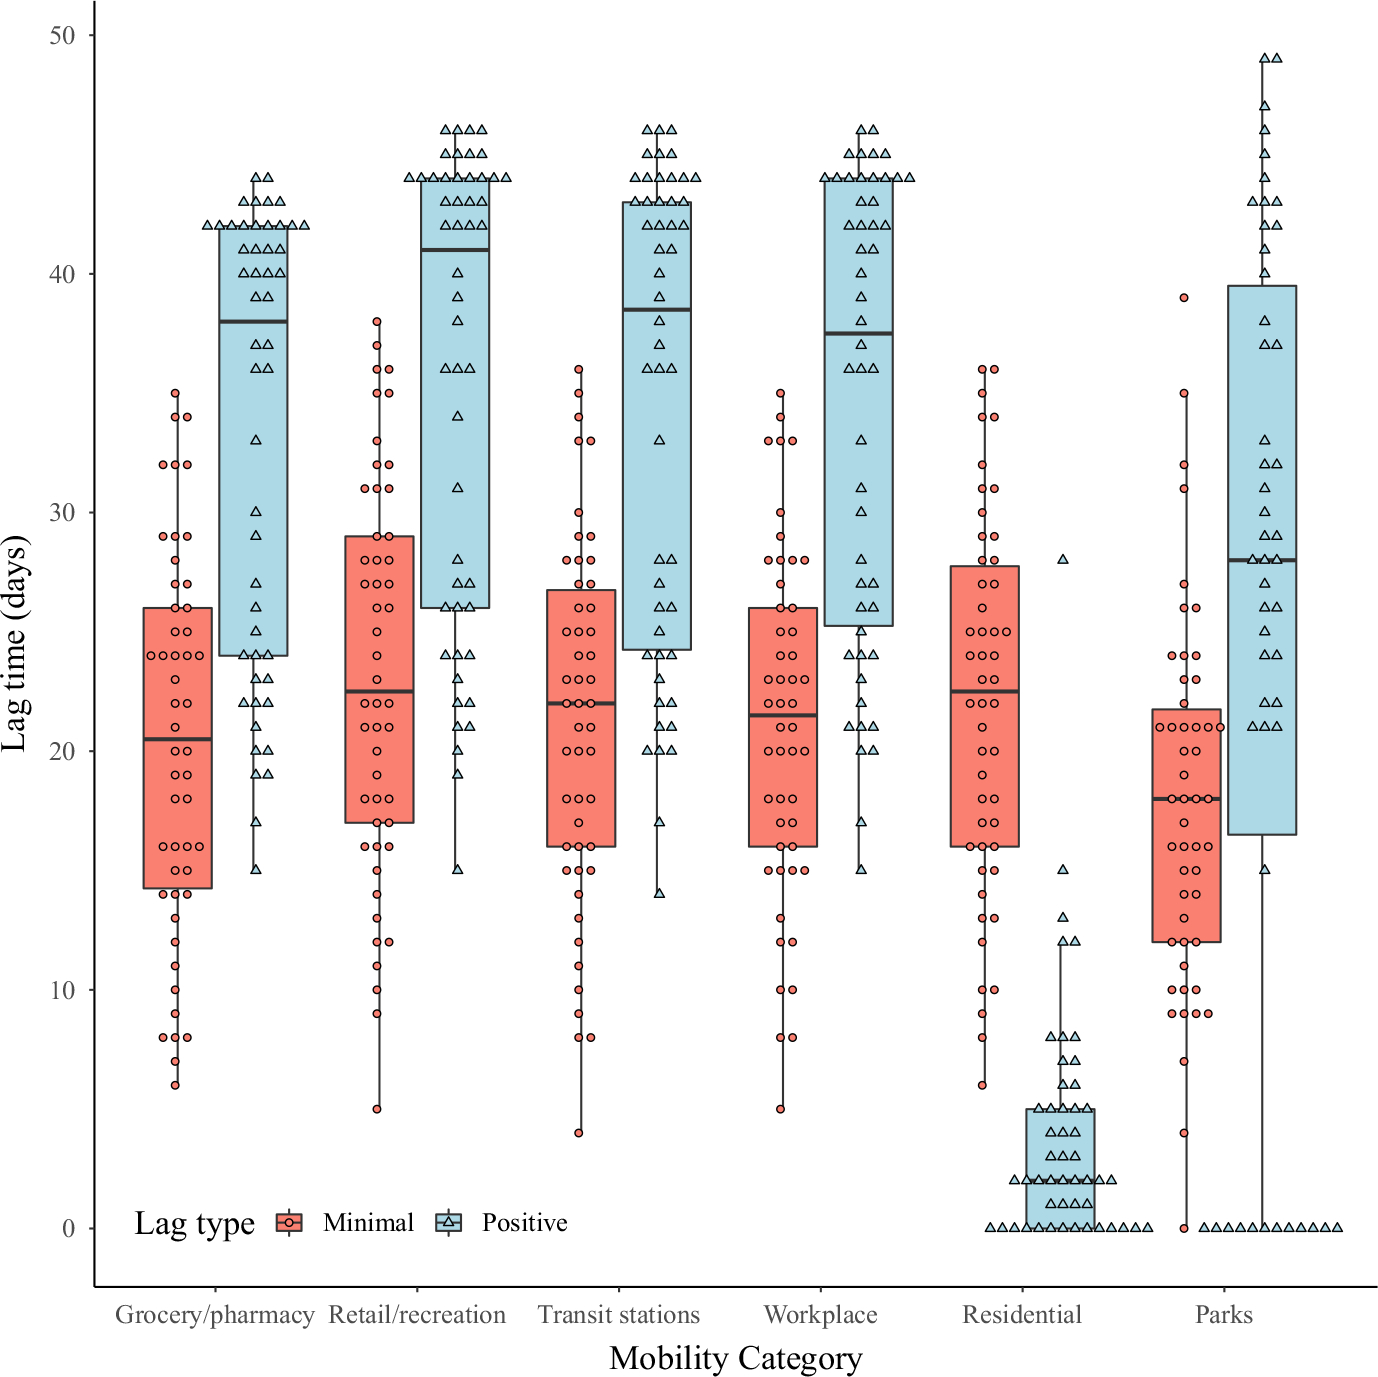
FIGURE 2.

Lag time (in days) between reductions in daily mobility measurements and declines in daily case incidence of severe acute respiratory syndrome coronavirus 2 (SARS-CoV-2) in the United States, as estimated from cross-correlation analyses. Each data point represents the value for one state, and box and whisker plots compare the distribution of values among states within each mobility category and lag type. Two independent measures were considered: (a) the number of days until the inflection point from negative to positive correlation (‘minimal correlation’), which is hypothesized to be the amount of time it took for social distancing to contribute to initial declines in case numbers, and (b) the number of days until the maximum positive correlation, which could reflect the time it took for social distancing efforts to have maximal effects on case incidence. Mobility was measured as one of six categories based on the type of locations used by the public: grocery and pharmacy locations, retail and recreation locations, transit stations, workplaces, residential areas (e.g. houses and apartments) and parks
