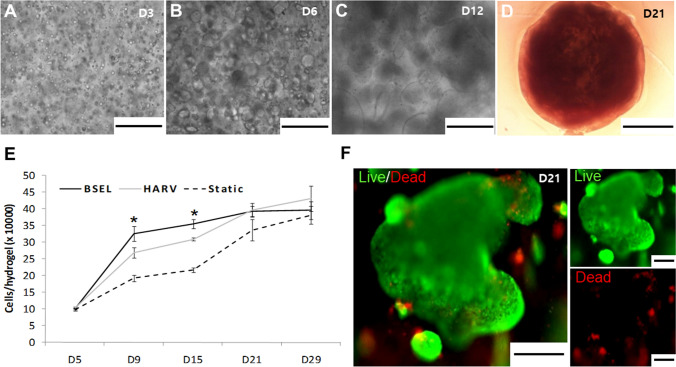
Fig. 3.
Growth kinetics of encapsulated ESCs. A–D Microscopic observation of the ESC-colonies growing over the culture period. Scale bars are 500 μm on D3 (A), D6 (B), and D12 (C). The beads became visually opaque with fully packed ESC-colonies on D21 (D). The scale bar indicates 1000 μm. E Cellular growth kinetics of all 3D-culture conditions were examined by a DNA quantification method during the culture period. F Cell viability in the tissue constructs was examined on day 21 using a Live/Dead assay kit (live, green fluorescence; dead, red fluorescence). Scale bars are 200 μm

