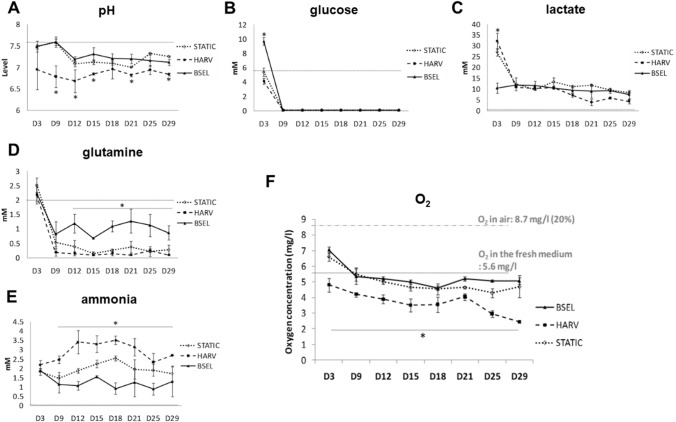
Fig. 4.
Profiling of culturing factors in the 3D-culture conditions. Culture media from all groups were collected during the culture period and the bioprofile information was analyzed by measuring A pH, B glucose, C lactate, D glutamine, and E ammonia, and F oxygen. The fresh culture medium was measured as a control and indicated in each plot by a dotted line. All the statistics were done between the BSEL and HARV groups by a student t test (n = 3). All error bars are standard deviation (SD). Asterisks indicate p < 0.05

