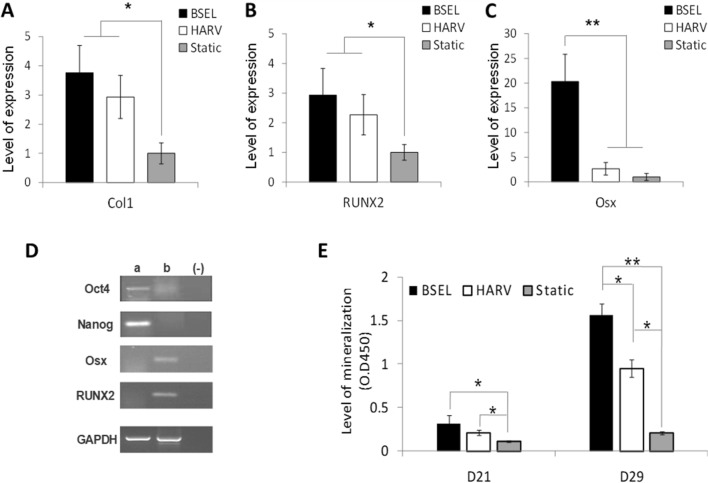
Fig. 5.
Analyses of osteogenic differentiation and mineralization. Osteogenic constructs were collected at the end of culture period (D29) from all 3D-culture conditions. A–C Comparisons of osteogenic gene expressions: A type I collagen (Col1), B Runx2 (RUNX2), and C Osterix (Osx). All quantitative comparisons were normalized by the correspondent gene expression level of the Static group based on the 2−ΔΔCT method. Statistical analysis was performed by one-way ANOVA (n = 5) at a level of significance of p < 0.05 or p < 0.001 (single and double asterisks, respectively). All error bars represent standard deviation (SD). D Verification of pluripotency marker gene expression of Oct4 and Nanog; a pluripotent samples 3D-cultured for 13 days in the BSEL bioreactor using the medium containing the leukemia inhibitory factor (LIF); b osteogenic samples cultured for 29 days in the BSEL bioreactor following the osteogenic differentiation protocol; (−) negative control (water blank). E Comparison of mineralization of the 3D-culture groups based on a quantitative Alizarin Red S (ARS) assay. Statistical analysis was performed by one-way ANOVA (n = 5) at a level of significance of p < 0.05 or p < 0.001 (single and double asterisks, respectively). All error bars represent standard deviation (SD)

