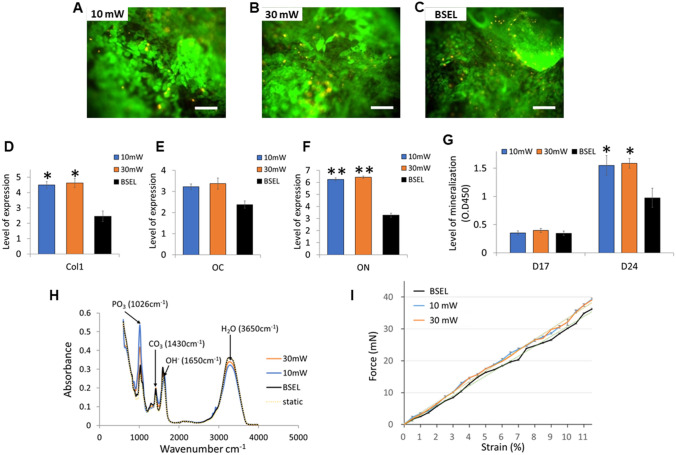
Fig. 7.
Results of the mineralized tissue constructs produced by using the low-intensity pulsed ultrasound (LIPUS)-mounted BSEL bioreactor (10 mW and 30 mW). A–C Cell viability in the tissue constructs was examined on day 24 using a Live/Dead assay kit (live, green fluorescence; dead, red fluorescence). Scale bars indicate 200 μm. D–F Comparisons of osteogenic gene expressions: type I collagen (Col1; D), E Osteocalcin (OC; E), and Osteonectin (ON; F). All quantitative comparisons were normalized by the correspondent gene expression level of the Static group based on the 2−ΔΔCT method. All the statistics were done by one-way ANOVA (n = 3). All error bars represent standard deviation (SD). Asterisks indicate p < 0.05. G Comparison of mineralization based on a quantitative ARS assay. Statistical analysis was performed by one-way ANOVA (n = 5) at a level of significance of p < 0.05. All error bars represent standard deviation (SD). H FTIR spectra indicating the molecular composition of hydroxyapatite of mineralized tissue constructs. I Mechanical strength analysis of the mineralized tissue constructs. The force–displacement characteristics were plotted and fitted by linear regression (dotted lines). Corresponding Young’s moduli were calculated based on this plot (Table 4)

