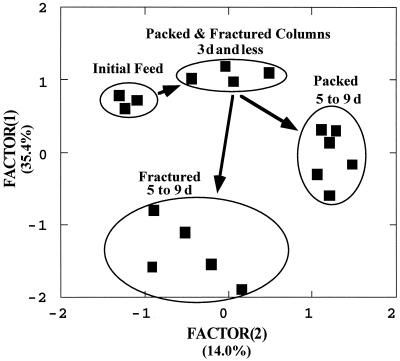
FIG. 1.
PCA factor plot of the community carbon source utilization patterns for effluent samples from both column types taken over a period of 9 days during a pilot study to determine the steady state of microorganism exchange within the columns. Replicate samples (n = 3) of the initial groundwater used for column feed are at the upper left part of the plot, while the effluent from fractured and packed columns for the first 3 days (d) is at top center of the plot. Effluent samples taken between 5 and 9 days after initial flooding of the columns show that the two column types arrived at independent steady states, as defined by the effluent community carbon source utilization patterns. n = 1 for the effluent sample for each type of column taken at each sampling date. Factors 1 and 2 accounted for 35.4 and 14.0% of the total variance in the data set, respectively.

