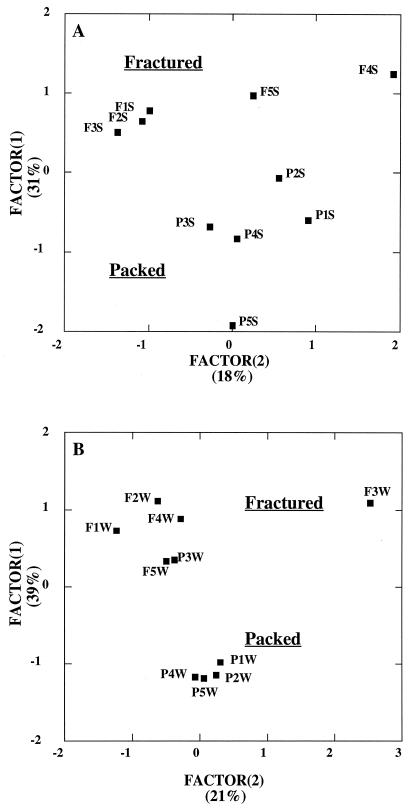
FIG. 7.
(A) PCA factor plot of community carbon source utilization patterns for crushed basalt extracts (Packed) and fracture faces (Fractured). Factors 1 and 2 accounted for 31 and 18% of the total variance in the data set, respectively. (B) PCA factor plot of community carbon source utilization patterns for effluent groundwater from crushed-basalt columns (Packed) and that from fractured columns (Fractured). Factors 1 and 2 accounted for 39 and 21% of the total variance in the data set, respectively.

