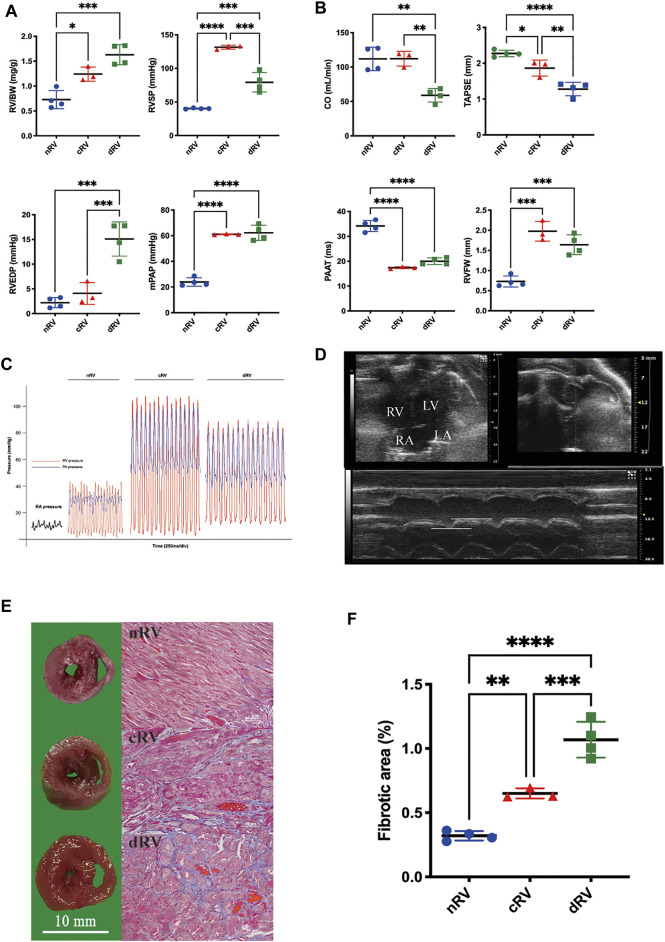
FIGURE 2.
Development of the rat model of monocrotaline-induced right ventricular failure. (A) RV weight and hemodynamic indexes evaluated by right heart catheterization of saline- and MCT-induced rats at cRV and dRV stages. (B) Right ventricular function indexes evaluated by echocardiographic of saline- and MCT-induced rats at cRV and dRV stages. (C) Pressure waves of the rat model from right heart catheterization. (D) An echocardiographic image of the four-chamber view of the rat heart and the explanation of how TAPSE was measured. (E) Cross-sectional view of the right ventricle and the fibrotic area estimated by Masson’s trichrome stain at nRV, cRV, and dRV stages. (F) The column chart of the fibrotic area at different stages. nRV, normal right ventricle; cRV, compensated right ventricle; dRV, decompensated right ventricle; RV/BW, ratio of right ventricle to body weight; RVSP, right ventricular systolic pressure; RVEDP, right ventricular end-diastolic pressure; mPAP, mean pulmonary arterial pressure; CO, cardiac output; TAPSE, tricuspid annular plane systolic excursion; PAAT, pulmonary artery acceleration time; and RVFW, right ventricular free wall thickness.

